Wednesday 17 December 2014

Prototyping a Graph Database

Last night we did a great meetup in Amsterdam using a new, untested format. We had about 25-30 people attending, to try and prototype a graph database quickly and efficiently.


You can find the slides (borrowed from earlier work done by the awesome Neo4j team, Ian Robinson most particularly) over here or embedded above, but here's the way we approached this, which I think could be a general way of doing things:

First: a Model

We spent a long time on what are some of the best practices in Graph Database modelling. Here are some of the key takeaways, in my opinion:
    • many of the modelling principles are similar to classical use story modelling as I first encountered it two decades ago in OO modelling. Create a story, extract the nouns and verbs to create a basic skeleton of the model.
    • think about your use cases and your query patterns long and hard. They will drive the model - you want to model for queryability.
    • Don't be afraid of normalisation. In relational modelling normalisation is expensive - in graph modelling it is not as much. You will tend to have "thinner" nodes and relationships in your graph model (holding fewer properties).
    • Don't be afraid of redundancy: it is very common to have redundancy in the model - within the same database. Look at the different ways to model email exhanges or marriage relationships - you immediately see there are more than one way of doing things, and none of them is necessarily better than the other. It *depends* on your requirements, your queries.
    • Iterate over the model - and understand that as your business requirements change, you may want/need to change the model. 
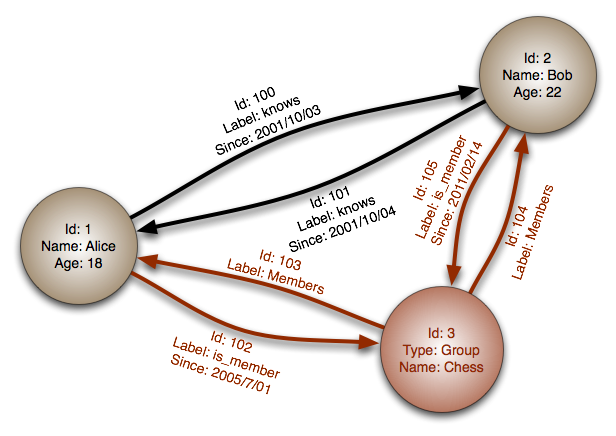
Here's what I ended up working on: a very simple model for a Configuration Management database, that would store Users in Departments of Companies, using a Service that relies on Hardware and/or Software:

I created that "drawing" with the Alistair Jones' "Arrows" tool. I have put the markup file over here.

Second: a prototype dataset

We then had a great time applying that model to generate an actual Neo4j database using Christoph Willemsen's GraphGen. It's amazing how quickly you can get a running Neo4j server populated with some sample data that is worth the while exploring. Here's my GraphGen model:
 /// CMDB GraphGen Example :  
 (customer:Company {name: company } *50)  
 (dept:Department {name: {randomElement:['IT','Sales','Marketing','Operations','Finance'] }} *100)-[:PART_OF *n..1]->(customer)  
 (u:User {name: fullName} *100)-[:PART_OF *1..1]->(dept)  
 (customer)-[:USES {percentage: {randomFloat:[2,0,1]}} *n..n]->(serv:Service {name: {randomElement:['Web','ERP','CRM','Mail','Calendar','Files']}} *10)  
 (serv)-[:USES *1..n]->(soft:Software {name: {randomElement:['OS','Database','Webserver']}} *3)  
 (serv)-[:USES *1..n]->(hard:Hardware {name: {randomElement:['Storage','Processor','Memory']}} *2)Here  

You can also find it on github. Pasting this into GraphGen gives you something like this:

Pushing the green "populate" button then fires of a bunch of Cypher queries that will create the database in your running Neo4j server in a matter of seconds:
This whole process works absolutely smooth as ever. It allows you to get a database up and running extremely quickly. It's really great.

Third: some traversals!

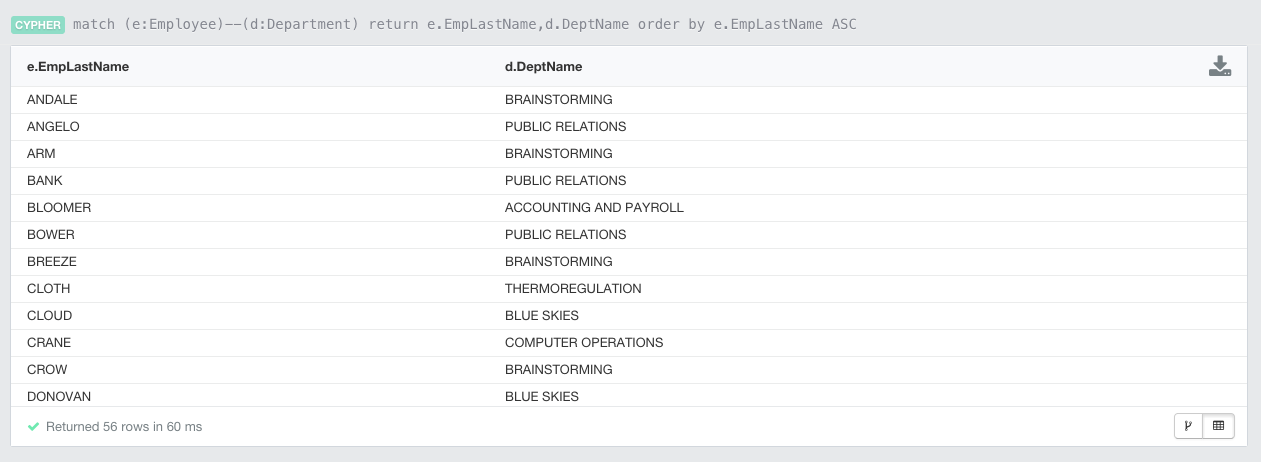
Last but not least, we then spent some time looking at the generated datasets and exploring some queries. To do that, I first had to add a few indexes for the queries to be efficient. Effectively adding the indexes on the labels' properties that I wanted to look up starting points with for my traversals. 

Next, I can do some queries that are quite typical of the "Configuration Management" domain, and we often see in various kinds of "Impact Analysis" use cases. Basically it means traversing the graph from two ends:
  • Starting from the Hardware/Software end: asking the question about who would be impacted if a particular piece of hardware/software would fail. An example query would look something like this:

 match (h:Hardware {name:"Storage"}),(u:User), p=AllShortestPaths((h)-[*..5]-(u))  
 where id(h)=865   
 return p;  

The result looks like this (the "Storage" device affected is at the center

  • Starting from the User end: asking the question about what hardware/software pieces a particular user accesses. The query looks like this:
 match p=Allshortestpaths((u:User {name:"Leland Blanda"})-[*..5]-(h:Hardware))  
 return p  

The result looks like this - the User in case is at the very right, and the systems he/she uses to the left.


All these queries are on github as well. You may need to change the identifiers for users/systems as they will obviously be different if you generate your own database.

All in all I thought this exercise was a very useful and a pleasant one. Going from zero to graph in a matter of hours is pretty interesting, and offers a lot of potential for iterative experimentation/prototyping.

Hope you found this useful. As always, feedback very very welcome.

Cheers

Rik


Friday 5 December 2014

Always look at the bright side of life!

A life lesson AND a great way to have fun together with one of the nicest colleagues: Nigel. He got me going on the Graph Karaoke thing, and now gave me another idea for a song that had to be sung, so he deserves the credit, and a picture:
As you can see, Nigel is a big fan of Karaoke, and his mission in life is to make you smile. He can't stop. It's amazing. Such a hero. And yesterday he was talking to me about how great it would be to have a Monty Python song in the Graph Karaoke playlist - so here we are:

Hihi. I guess I don't have a social life - and most definitely not when locked into a hotel room far away from home. 

Hope you enjoy it.

Rik

Thursday 27 November 2014

My Graph Journey - part 2

In a previous blogpost, I told you the story of how I decided to get involved in our wonderful Neo4j community. I refused to make a difference between the *commercial* aspects of the Neo4j project, and the pure, free-as-in-speech-and-as-in-beer open source project and community. I believe that are one, have to be one. But. Once I had sort of made up my mind about getting stuck into it, there was a whole new challenge waiting for me. Neo4j - at least two+ years ago when my journey started, was not the easiest tool to use. There were many obstacles along the way - and while many of them have been resolved along the way, some still remain. Let me take you through THAT part of my journey - the part where I actually need to make Neo4j my friend.

I am not a programmer

Probably the single most obstacle to myself getting involved with Neo4j as a user, was that I don’t know how to program. I mean, at University I did *some* programming, but I think the world should be thankful for the fact that none of my code ever made it into production. Seriously. I suck at programming. Probably because I don’t really enjoy DOING it. I like talking about it, I love watching OTHER people do it (!), but I just don’t have the talent or the inclination to really do development. Sorry.

But let’s face it, Neo4j in 2012 was really very much a *developer tool*. It was not, by any means, something that you could hand of to a business user, let alone a database administrator, to really use in production. And I am neither of those. I am a sales person, and I love my job with a passion.
So how could I ever get stuck in with a development centric open source project like Neo4j? Well, I believe it’s really simple.

  • Ask great people for help. Don’t be afraid or ashamed to say that you don’t know something, and ask the people that do know for assistance. There are some great people in our community, and even more so at Neo Technology. As one of my colleagues put it: “NeoTech is so great, because there are no assholes here…”. Haha. There’s a lot of truth in that: my colleagues are great, and they help me whenever they can. I would love have been able to write this blog, write the book, speak at conferences, without their support. 
  • Failure is good. I think that’s probably the biggest thing that I learned along the way - and that I see lots of people NOT doing - is that they hold back, for fear of failure. They are standing on the sea shore, and are afraid to jump in - in spite of the fact that there are swimming teachers, rescue vests, lots of other swimmers and even the rock-star shark fighters available if something would go wrong. People just don’t try. And when they fail, they don’t ask for help (see above) and retry.
Trying something, failing, and then being able to humbly ask for help and assistance is the most powerful thing. You’re not failing because you are stupid. You’re bound to fail if you try something new… no guts, no glory! But so many people, so so many of them, never do try. It’s a shame. That’s basically how I got to try Neo4j, bump my head against brick walls time and time again, but after a while, feel like I was getting somewhere. That was a gradual process - but it felt and feels great. Now let me tell you about the two three powerful learning experiences that I had, from a more technical perspective.

Learning Neo4j

Of course, a Graph Database like Neo4j is new, or at least newish technology. So it is bound to be a bit different, and rough around the edges. If you can’t live with that, times are going to get rough. So what were the key new things that I had to get my mind around? Let’s go through the top three.

1. Learning how to Model

Modelling in a graph database is different, especially if you come from a relational background. Relational databases have many good things about them, but one of the inherent limitations to that model is that it’s actually quite “anti-relational”. What I mean is: every time you you introduce a new connection between two entities, you pay the price of having to join these two entities together at query time. Even worse in n-to-m connections, as that introduces the unnecessarily complex concept of a “join table”. So, so annoying. But the thing is, that we are used to thinking in that way - that’s how we were educated and trained, that’s how we practiced our profession for decades, so … we almost can’t help it but doing it that way.

The fundamental difference in a graph model, I believe, is that introducing relationships/connections is cheap - and that we should leverage that. We can normalise further, we can introduce new concepts in the graph that we otherwise forget, we can build redundancy into our data model, and so on and so on. I won’t go into the details of Graph Database modelling here, but suffice to say that it’s different, and that I had to go through a learning curve that I would imagine would required for most people. It pays to model - and you should take your time to learn it, or ask for assistance to see if it makes good sense or not.

2. Learning Import

Once you have a model, you probably want to import some data into it. That, for me, was probably the biggest hurdle that I had to get over in order to learn Neo4j. I remember messing about with Gephi and Talend trying to generate a Neo4j database just to avoid having to use the import tools that were available 2.5 years ago, and asking myself why oh why is that so difficult. Surely there must be better ways to do that.
I meanwhile believe that Importing data into a Graph Database is *always* going to be a bit tricky (for the simple reason that you have to write data AND structure at the same time), but that there are specific tools around for specific import use cases. Now, luckily, these tools have moved on considerably, and I think if you look at my last “summary” of the state of Neo4j import tools, it has gotten a LOT better. My rule of thumb these days is that
  • for anything smaller than a couple of thousand nodes/relationships, I will use cypher statements (often generated with a spreadsheet, indeed) to import data. 
  • for anything up to a couple hundred thousand, and lower millions of nodes and relationships, I will usually resort to using LoadCSV, the native ETL capability of Cypher.
  • for anything that requires higher millions or billions of nodes and relationships to be imported, I will use the offline, batch-oriented tools.
It took me a while to understand that you actually need to use different tools for different import scenarios - but that’s just the way it is, at least today.

3. Learning Cypher

Last but not least, I really feel that learning Cypher, the declarative query language of Neo4j, is totally worth the while. It may seem counterintuitive at first: why do I need to learn yet-another-query-language to deal with this Neo4j thing - until you start using it. Things that are terribly hard in SQL, become trivially easy in Cypher. Queries of a 1000 lines or more in SQL, fit on half a page in Cypher. It’s just so, so powerful. And I have found that the learning curve - even for a non-developer like myself - is very, very doable. I would not call myself a Cypher expert, but I definitely feel more than confident enough today to handle quite sophisticated queries. And again: if I get stuck, I nowadays have books about Cypher, websites like Wes’, and friendly people everywhere to help me. Cypher - in my opinion - is the way to go, and Neo4j is only going to make it better with time.

That’s about it, in terms of my big lessons learnt on this wonderful Graph Journey. So let’s wrap it up.

Having fun while learning

I think the final thing here that I would like to add is that Learning Neo4j, even though a bit painful sometimes, has been a tremendously FUN experience, above all. Why otherwise would I come up with Graph Karaoke?


I believe that to be really, really important. Learning should be fun. So the more you can play with interesting datasets, the more you have the opportunity to share and discuss about that with your friends and colleagues, the more fun you will have and the more you will enjoy getting stuck in and learn some more. So set yourself up that way. Don’t be a lonely document out there - but connect with others and leverage the graph. I for one, am not regretting it for a second.

Hope this story was useful. Comments and questions always more than welcome.

Cheers

Rik

Monday 24 November 2014

My Graph Journey - part 1

Well, since everyone is doing it, and Michael asked me to write up my own graph journey...
 I thought I might as well do so. Maybe it will be useful for others. Challenge accepted.

How it started

I guess to really understand how I rolled into Graph Databases I have to take you back to the days of my university thesis. I graduated from the University of Antwerp in 1996, and at the time, I wrote a master's thesis about a "Document Management" solution. This was when the Internet was just starting to emerge as a serious tool, and for months I worked at EDS to figure out a way to use, size (storage was EXPENSIVE at the time!) and evaluate the tool. This turned out to be pretty formative: the tool (Impresario Ovation, later acquired by Wang) was a full-on client/server architecture, relying heavily on MS SQL Server 4.2 (the Sybase OEM). And I had to dig into the bowels of SQL server to figure out a way to size this thing. That, my friends, was my first and deepest exposure to SQL. And to be honest: I found it deeply, profoundly painful. I was deeply embedded in a complex data model full of left-right-inner-outer-whatever joins, and felt it was just... cumbersome. Very. Cumbersome.

After completing the thesis, I went on to graduate and start to work. First in academia (not my thing), then at a web agency, where I first got to know the world of Web Development at SilverStream Software. Don't want this to turn into a memoire, but that's when I got exposed to Java for the first time, that's where I learned about Objects, that's where I started following the writings of Rickard (at theserverside.com, at the time) who was developing JBoss, it's when I learned about Open Sources and... met Lars. Lars was working for Cambridge Technology Partners at the time, and they too just got acquired by Novell. CTP and SilverStream had many things in common, and we found eachother. We worked on a few projects, but then our ways parted. I left Novell to do a great startup called Imprivata, moved out of the world of app development - but always kept in touch with Lars.

How I bought into it

Years later, Lars and I reconnected. I had been working in the Identity and Access Management industry for a while, and ... got a bit sick and tired with it. I needed a change, and started to read about this brave new thing called Big Data and NoSQL. Friends of mine had been working on a next gen data architecture at a local startup called NGdata. Interesting stuff, but I somehow did not buy the "big is beautiful" argument. Surely not everyone would have these "big data" problems? Sure, they have big "data problems", but not necessarily because of volume?

And that's when Lars and I hooked up again. He called me to see if I was interested in joining Neo Technology, and after doing a bit of research - I was sold completely. Emil's vision of "Helping the world make sense of data" just really resonated with me. I knew what relational databases were like, and hated their "anti-relational" join patterns, and I had vaguely heard of networks, of graphs - and it just seemed to "click". I instinctively liked it. And accepted a job at Neo on a hunch - never regretted it to this day.

How I got sucked into it

When I started to work at Neo, the first thing I experienced was a company event. It was held at the lovely farm of Ängavallen, Sweden. I met some of the loveliest people then for the first time - all my colleagues at Neo now for more than 2.5 years. I love them dearly. But. There was a clear but.

Turns out that Neo Technology, the company that Emil, Peter and Johan had so lovingly built over the years, was a true and real hacker nirwana. It was very, very different from any company that I had ever worked for in the past, and I must say - it was quite a shock at first. This was the first time that I worked for an Open Source company, and looking back at it now it seems to me like it has all the positives, and some negative traits to it.

The thing is, of course, that this Open Source company was very, very motivated by the craft of software engineering and building out something technically sound, something they could be proud of, something that would stand the test of time, something that would change the world for the better. It was - and still is - very ethically "conscious", meaning that we want to do business in a way that is ethically sound. All very admirable, but if there is one thing that my 15+ years of selling hi-tech software had taught me, it was that that was not necessarily a recipe for commercial success. The market does not always award success or victory to the most technically sound or most ethical company - on the contrary. Selling high-tech software products is not always a walk in the park - and sometimes you need to make tough, ruthless calls - I know that, from experience.

So needless to say that this was a bit of a clash of cultures. Here I was, a technically interested but primarily business-minded sales professional, in a company that ... did not really care about sales. That's what it felt like, at least. I remember having numerous conversations with my colleagues and with other members of our wonderful Neo4j community, saying that there was this big divide between "commercial" and "community" interests. One could never be reconciled with the other, worse still, one - per definition almost - had to be opposed to the other.

I never got that. 

I never got that the "community interest" was different from the "commercial interest". To me they are, and have to be, one and the same.

Getting involved in the community

My logic was and still is very simple: if the "community" wants to thrive, there has to be a sustainable, continued and viable commercial revenue stream to it. If the commercial interests want to thrive, there has to be a large and self-sustaining community effort underpinning it. That commercial interest should not be the "used car sales" kind of commercial interest - but real, genuine commercial interests following from the ability to make customers successful and provide value to them in the process. My favourite sales book of the last decade is "Selling is dead" for a reason: selling means adding value to your customers' projects - not just chasing a signature on a dotted line. I wrote down my vision for commercially selling Neo4j in this prezi:

Community and Commercial interests have to go hand in hand, in my humble opinion. And that, my dear friends, is why I decided to get stuck in, to learn Neo4j myself, to write about it, to blog about it, to publish books about it, to talk about it at conferences, to write this blogpost.

My lifeblood, the thing that makes me tick, is making customers successful. I just love that. But I have learned over the years that in order to do that I will work with a mixture of tools that are partly purely commercially motivated, and partly motivated by the sense of open source community building that is so different from traditional commercial software vendors.

That, to me, was the most important part of my Graph Journey. A sales guy like myself, getting stuck in pure community building around the Neo4j project. A long term perspective on bringing this product and project to fruition. It has been a great experience so far, and I hope to continue it for a long time to come.

Thanks for the ride so far. All of you.

Cheers

Rik

PS: I will write about my actual learning experience wrt Neo4j later, in part 2. But I thought that the above was actually more important.

Saturday 15 November 2014

The IDMS EmpDemo - reloaded

A couple of weeks ago, I told the story of the interesting conversation that I had had with Luc Hermans about the similarities between IDMS and Neo4j. Luc gave me access to the EmpDemo dataset that ships with IDMS, and I sort of challenged myself saying that I would love to revisit his 2012 effort to import the data into Neo4j and do some queries on it. Not to see if you could migrate data from IDMS to Neo4j (that would be WAY more complicated, with all the software dependencies, of course), but just to explore the model similarities.

Now, several weeks later, I have something to show you. It's not always very pretty, but here goes :) ...

The IDMS schema file & sequential data

The IDMS input data was essentially structured in two files.
  1. The schema file. This file was pretty long and complicated, and describes the structure of the actual data records. Here's an excerpt for the "Coverage" data records:
     RECORD NAME IS COVERAGE  
          SHARE STRUCTURE OF RECORD COVERAGE VERSION 100  
          RECORD ID IS 400  
          LOCATION MODE IS VIA EMP-COVERAGE SET  
          WITHIN AREA INS-DEMO-REGION OFFSET 5 PAGES FOR 45 PAGES  
     *+    RECORD NAME SYNONYM IS COVERGE FOR LANGUAGE ASSEMBLER  
     *+    RECORD NAME SYNONYM IS COVRGE FOR LANGUAGE FORTRAN  
     *+    OWNER OF SET COVERAGE-CLAIMS  
     *+      NEXT DBKEY POSITION IS 4  
     *+      PRIOR DBKEY POSITION IS 5  
     *+    MEMBER OF SET EMP-COVERAGE  
     *+      NEXT DBKEY POSITION IS 1  
     *+      PRIOR DBKEY POSITION IS 2  
     *+      OWNER DBKEY POSITION IS 3  
          .  
     *+  02 SELECTION-DATE-0400  
     *+    USAGE IS DISPLAY  
     *+    ELEMENT LENGTH IS 8  
     *+    POSITION IS 1  
     *+    ELEMENT NAME SYNONYM FOR LANGUAGE ASSEMBLER IS COVSELDT  
     *+    ELEMENT NAME SYNONYM FOR LANGUAGE FORTRAN IS CVSLDT  
     *+    .  
    
    As you can see it is all about the "positions" of the data in the file: where does the record start, where do the fields in the record start and end - in the sequential file.
  2. The sequential file itself was a lot shorter in this case (it is just a small dataset). The coverage records mentioned above look something like this.
     C 00303011978110100000000F003  
      C 00403011975030100000000D004  
      C 00200031977012100000000M002  
      C 00400071978043000000000F004  
      C 00100111980092900000000M001  
      C 00200131981010200000000D002  
      C 00100161978010600000000M001  
    
    As you can see, all it is is a sequence of ASCII numbers that then need to be split up into the different fields, as defined in the schema above. Interesting. 
Unfortunately I can't share the actual files in public - but the above should give you a good idea what I started from.

Struggling with Sequential files - not my forte

Once I grasped these file structures a little bit, I continued to see how I could work with them to create an "importable" format for my Neo4j server. Turned out that was not that easy. I ended up using a two part process:


  1. I used a spreadsheet to convert the individual records into structured fields that I could work with. Here's the link to the google doc, if you're interested. Google Sheets has a function called "mid", that allows you to pick contents from a cell's sequential positions:

    which was exactly what I needed to do. Once I ficured that out, it was pretty easy to create the nodes in my Neo4j server. But how to extract the relationships???
  2. Turns out that I really did not manage to do that. I had to turn to Luc for help, and he basically managed to create a CSV file that used record IDs as the key to establish the relationships. Not pretty - and I still have no clue how he did that (let's just attribute it to the secret art of mainframe wizardry :)), but it did work...
Once I had this all I had to do was to use the structured information in my spreadsheet to generate cypher statements that would allow me to create the graph in Neo4j. That was easy. You can find the statements over here.

Updating the IDMS model to Neo4j

As I already mentioned in the previous blogpost, the similarities between IDMS and Neo4j data models are multiple, but there are also some differences. One of the most striking ones - for me at least - was how IDMS deals with many-to-many cardinalities in the data model. Including these types of relationships in IDMS requires the creation of a separate kind of "record", called a "Junction record". This is a the best explanation that I found over here:
For each many-to-many relationship between two entities, we will almost always identify additional attributes that are not associated with either of the two entities alone, but are associated with the intersection between the two entity types. This intersection is represented by another record type, called junction record type, which has one-to-many relationships with the two entity types. The junction record resolves the many-to-many relationship and implements this many-to-many relationship indirectly. 
Thinking about this some more: junction records are very similar to the relational database concept of a "join table". And as we know, we don't need stuff like that in Neo4j, as you can natively create these kinds of n to m relationships in Neo4j without having to think twice.

So that means that we need to make some updates to the data model, as Luc had already done in his effort. You can clearly see what needs to be done in the figure below:

In the IDMS data model we have three junction records:
  • the Emposition: relating the Employees to their jobs
  • the Expertise: relating the Employees to their skills
  • the Structure: creating a reporting line / managerial relationship between two employees.
So we need to write a Cypher statement that would update the graph accordingly. Here's an example of how I did that for the relationship between Employee and Job:

 //create direct link between employee and job (removing need for "Emposition" juncture record)  
 match (e:Employee)-[r1]-(emp:Emposition)-[r2]-(j:Job)  
 create (e)-[r:JOB_EMPLOYEE]->(j)  
 set r.EmpID=emp.EmpID  
 set r.StartDate=emp.StartDate  
 set r.BonusPercent=emp.BonusPercent  
 set r.SalaryAmount=emp.SalaryAmount  
 set r.OvertimeRate=emp.OvertimeRate  
 set r.EmpositionCode=emp.EmpositionCode  
 set r.CommissionPercent=emp.CommissionPercent  
 set r.FinishDate=emp.FinishDate  
 set r.SalaryGrade=emp.SalaryGrade;  
 //delete the redundant structure  
 //delete r1,r2,emp  

Note that the properties of the junction record (eg. startdate, salary, and others) are now moved from the junction record to a relationship property. Property graphs make relationships equal citizens, don't they! The full update statements that I created are over here. I have put the graph.db folder over here if you want to take if for a spin yourself.

So now, let's do some querying of this dataset with Cypher!

Querying the Reloaded EmpDemo with Cypher

One of the key differences between IDMS and Neo4j seems to be to me that we now have this wonderful query language at our fingertips to explore the network data. IDMS does have some query facilities (using a SQL overlay on top of native IDMS, as I understand it), but it seems to me like the Neo4j approach is a lot more flexible.

Here are some example queries:

 //what's in the dataset  
 match (n)  
 return labels(n), count(n)  
 order by count(n) DESC;  

Gives you the following result:

Or lets do some deeper queries:

 //Show employee and departments  
 match (e:Employee)--(d:Department)   
 return e.EmpLastName,d.DeptName   
 order by e.EmpLastName ASC  

Gives you:
Of course we can also look at some more graphical representations of our newly reloaded EmpDemo.  To illustrate this, let's look for some shortestpaths between Departments and Skills (bypassing the junction records that we mentioned above):

 //Paths between departments and skills  
 match p=Allshortestpaths((d:Department)-[*]-(s:Skill))   
 return p  
 limit 5;  

This gives you the following result:
Or similarly, let's look for the paths between departments and the different types of claims. This is a bit more interesting, as have different kinds of claims (Dental, Hospital, and Non-Hospital) which currently all have different labels in our data model. We can however, identify them as they all have the same "COVERAGE_CLAIMS" relationship type between the coverage and the different kinds of claims. So that's how the following query was split into two parts:

 //paths between departments and claims  
 match (c)-[ccl:COVERAGE_CLAIMS]-(claim)  
 with c, claim  
 match p=Allshortestpaths((d:Department)-[*]-(c:Coverage))  
 return p,claim  
 limit 1;  

First we look for the Coverage "c" and the Claims "claim" and then we use the AllShortestPaths function to get the links between the departments and the coverage. Running this gives you this (limited to 1 example):

Finally, let's do one more query looking at a broad section of the graph that explores the Employees, Skills and Jobs in one particular department ("EXECUTIVE ADMINISTRATION"). The query is quite simple:

 //Employees, Skills and Jobs in the "Executive Administration" department  
 match p=((d:Department {DeptName:"EXECUTIVE ADMINISTRATION"})--(e:Employee)--(s:Skill)),  
 (e)--(j:Job)  
 return p,j;  

and the result gives you a good view of what goes on in this department:

Obviously you can come up with lots of other queries - just play around with it if you feel like it :)

Wrapping up

This was a very interesting exercise for me. I always knew about the conceptual similarities between Codasyl databases and Neo4j, but I never got to feel it as closely as with this exercise. It feels as if Neo4j - with all its imperfections and limitations that make it probably so much less mature than IDMS today - still does offer some interesting features in terms of flexibility and query capabilities. 

It's as if our industry is going full circle and revisiting the model of the original databases (like IDMS), but enhancing it with some of the expressive query capabilities brought to us by relational databases in the form of SQL. All in all, it does sort of reinforce the image in my mind at least that this really is super interesting and powerful stuff. The network/graph model for data is just fantastic, and if we can make that easily accessible and flexibly usable with tools like Neo4j, the industry can only win. 

Hope this was as useful and interesting for you as it was for me :) ... as always: comments more than welcome.

Cheers

Rik

Friday 7 November 2014

Wasting time as a boothbabe @ Oredev

This blogpost essentially references a GraphGist that I created. Look at it in a full window over here, or below: I hope that was interesting - let me know if you have any feedback.

Cheers

Rik

Friday 31 October 2014

Simulating the IDMS EmpDemo using GraphGen and GrapheneDB

A couple of weeks ago, someone put me in touch with Luc Hermans of P&V Group. Luc had done this presentation 2 years ago about loading the default CA IDMS EmpDemo database into Neo4j. That triggered my interest bigtime, as my recollection of IT history strongly remembers mainframe database technologies as the hotbed for many of our present-day data technologies.

On the wikipedia page it has a bit of background:
IDMS (Integrated Database Management System) is primarily a network (CODASYL) database management system for mainframes. It was first developed at B.F. Goodrich and later marketed by Cullinane Database Systems (renamed Cullinet in 1983). Since 1989 the product has been owned by Computer Associates (now CA Technologies), who renamed it Advantage CA-IDMS and later simply to CA IDMS.
If you think about it for a minute, you immediately understand that these technologies are conceptually very similar, and that "the EMPDEMO" would probably also be a great example of the power of Neo4j.

Now I would love to load the exact same dataset into Neo4j, and have been trying to redo Luc's exercise of loading the data into Neo4j myself. But it is not that easy if you don't have a mainframe background. The model, however is easy enough to understand. Here's the "old" IDMS model:

And Luc created this Neo4j graph model on top of that:
You can immediately spot the similarities, can't you! It's just very, very similar. In fact, the Neo4j model seems a bit easier, since the "junction" nodes in the IDMS model (that represent many-to-many and reflective relationships in the IDMS world) can be eliminated through properties on the direct relationships (see the orange Emposition, Expertise and Structure elements that can be eliminated from the IDMS model). Nevertheless IDMS and Neo4j seem to be - at least philosophically - very related technologies. Even the implementation has some shared characteristics, although I bet that any *real* expert will tell you that IDMS is way more powerful in some ways, but Neo4j is probably more flexible.

Simulating the EMPDEMO with Neoxygen GraphGen

While I was trying to actually do the import of the EMPDEMO sequential files into Neo4j - which I am sure I will succeed at doing, some day - I thought that it would very likely be way easier to "simulate" the same concepts that the EMPDEMO domain is representing, from a vanilla Neo4j install. How? By generating the dataset of course. So then I started thinking about how to do that, and the remainder of this post is going to be about that.

Turns out that Christoph Willemsen has been developing his suite of PHP tools for Neo4j, among which an incredibly lovely data generator, GraphGen. This is a brand new toolset that Christoph has made, and I must say it is absolutely lovely.

Using GraphGen is simple:

  • you describe your domain (ie. the EMPDEMO model that we have above) in a cypher like syntax, specifying the number of nodes that you want to be generating and the cardinality of the relationships that you want generated. It's really like translating the picture above into Ascii Art :) ... 
     
  • In my case, this looked like this:
 (empl:Employee {firstname:firstName, lastname:lastName} *100)-[:HAS_SKILL *n..n]->
(skill:Skill {name: progLanguage} *25)  
 (empl)-[:WORKS_AT_DEPT *n..1]->(dept:Department {id: {randomNumber: [2]}} *5)  
 (empl)-[:LOCATED_AT_OFFICE *n..1]->(office:Office {id: {randomNumber: [2]}} *10)  
 (empl)-[:HAS_JOB *1..1]->(job:Job {id: {randomNumber: [2]}} *2)  
 (empl)-[:HAS_COVERAGE *1..1]->(coverage:Coverage {id: {randomNumber: [2]}} *10)  
 (coverage)-[:HAS_CLAIM *1..n]->(HospClaim:HospitalClaim {id: {randomNumber: [2]}} *5)  
 (coverage)-[:HAS_CLAIM *1..n]->(NonHospClaim:NonHospitalClaim {id: 
{randomNumber: [2]}} *5)  
 (coverage)-[:HAS_CLAIM *1..n]->(DentClaim:DentalClaim {id: {randomNumber: [2]}} *5)  

  • you paste it into the website and you get something like this
    This is the direct link to it.
  • Once you've got that, you can download the cypher statements to generate the graph locally, or - and I can't tell you how useful that is, in my opinion - generate the database in one go. 
Let's take a look at that now.

From GraphGen to GrapheneDB - one simple click

Generating the database locally is of course one option - but in this case I think it is useful to experiment a bit using GrapheneDB. Maybe you have never used GrapheneDB - but let me tell you that it's pretty sweet for standard prototyping and experimentation. They have a free tier for sandbox graph databases:
This is plenty for most prototypes. In our case here, I will create the IDMSEMPDEMO sandbox database, and then... use the connection details specified below to connect GraphGen to it over the REST API.

Using the GraphGen system, I can now just immediately let the page generate the graph on YOUR GrapheneDB Neo4j server, through the REST API. It starts with some basic information:

and then all you need to do is wait a few seconds to have it complete:

Job done. Now I can start interacting with the graph on the Neo4j Browser hosted on Graphene.

Querying the Simulated EMPDEMO

Here's what the new Empdemo looks like in the shiny Neo4j Browser:
Now we can start thinking of some additional queries. I am no IDMS expert - on the contrary - but what I understood from my conversations with Luc is that you really need to think about the IDMS schema BEFORE you do any queries. If your query patterns are misaligned with the schema - then there's a redesign task to be done for it to work. That's very different to the Neo4j model. Of course, there's a clear and definite interaction between model and query pattern, and things may run more slowly/faster in one model as opposed to another model - but it will still be possible. And adjusting the model in Neo4j is... dead easy.

So here are some queries:

 //find employees  
 match (e:Employee) return count(e);  
 match (e:Employee) return e.firstname, e.lastname;  
   
 //find employee skills  
 match (e:Employee)-[:HAS_SKILL]->(s:Skill)  
 return e.firstname, e.lastname, count(s)  
 order by count(s) desc;  
   
 //find avg nr of employee skills  
 match (e:Employee)-[:HAS_SKILL]->(s:Skill)  
 with e, count(s) as nrofskills  
 return count(e), avg(nrofskills);  
   

Here's what the second query looks like in the Browser:

Many of those query patterns will be similar to what you could do in IDMS, but there are some query patterns that are perhaps a bit different. Like the following example: a pathfinding query:

 //find paths  
 match p=allshortestpaths((n:Employee {lastname:"Howe"})-[*]-(m:Employee 
{lastname:"Herman"})) return p limit 5;  

Doing that is really easy in Neo4j, and the results are very interesting:
Without knowing anything about the schema or the potential paths between two elements in the network, I can gain some interesting insights about the connections/relationships between my different entities.

This of course is just a start. But all I really wanted to do with this post was to highlight that
  • there is a very natural match/fit between the IDMS mainframe model, and the modern-day Neo4j model
  • It is trivial to simulate that model using fantastic new tools like GraphGen
  • It is even easier to actually take that model for a spin on GrapheneDB
Hope that was useful. As always, feedback is very welcome.

Cheers

Rik


Thursday 23 October 2014

Graph Karaoke!

Now that GraphConnect is almost behind us, I can finally talk about and publish the playlist that I have been compiling of songs that I have loaded in Neo4j.
Thanks to Nigel Small for the creative ideas along the way - onto many more musical discoveries!!!

Cheers

Rik

Friday 17 October 2014

Using graphs for recommendations

Last month the wonderful people of Data Science Brussels invited me to do a talk about HR Analytics and how graphs fit into that. The material is over here. It was a great night, so when Philippe told me that the next meeting was going to be about Data Science in Marketing - I just had to invite myself. So yesterday, I had a the pleasure - again :) - to do a talk at the  about how you could use graphs in Marketing.

The thing that I focussed on was the topic of recommendations and recommender systems. In a world where content is king, and consumers are always looking for specific deals that would fit their profile best, these systems are going to become critically important.

In my mind, these systems always consist of two parts:

  • a Pattern discovery system, where you - somehow - figure out what the patterns are that you are looking for. Could be by asking a domain expert, but could just as well be through some advanced machine learning algorithm. 
  • a Pattern application system, where you start operationalising the patterns that you have found and applying them in real world applications, either in batch, or in near-real-time.

I believe that graphs and graph databases offer tremendous potential for this domain, and have tried to illustrate that in this talk. The key points being that

  • Graphs excel at making these recommendations in real time. No more batch precalculations - just deliver the patterns you uncover as they develop.
  • Graphs benefit from some of the most fascinating data analytics techniques out there: triadic closures, centrality measures, betweenness measures, PageRank scoring - all of which help you determine what parts of the graph really matter, or not.
  • Graphs benefit from some operational advantages (among which: graph locality in your queries) to make them operationally very efficient.
I am sure I am missing stuff here, but these seem to be the most important pieces, to me.

The slides are on SlideShare, and included below:


The demonstration that goes with this was also recorded below. It's a little long, but I hope it's still interesting:

I hope this was a useful illustration for you of this fascinating use case. Any feedback - as always - greatly appreciated.

Cheers

Rik

Thursday 16 October 2014

How graphs revolutionize Identity and Access Management

I have been a big believer in Identity and Access Management technologies for the longest time. I spent many years of my professional life working for companies like Novell, Imprivata and Courion - trying to make organisations improve their policies and processes when it comes to authentication, roles and rights. The fundamental reason why spent so much time in that industry is that I truly am convinced of the fact that security threats usually (I say this full knowing that there are of course spectacular exceptions) are not external to organisations - it's usually the disgruntled employee that missed a promotion, or the inadvertent administrator making mistakes with catastrophic security effects. That's how security threats happen most of the time - not because of some external hacker. That's mostly the stuff that movies are made of - not reality.

But: I left that industry two and a half years ago, and started working for NeoTech, because I was sick and tired of the whole thing. Access Management (like Imprivata's toolset) is pretty ok - but "Identity Management" - djeez it's really a big f'ing mess. Maybe I am exaggerating a bit, but I remember thinking what a perverted, dishonest, and utterly money-squandering industry it was. Perverted and dishonest because most of the "products" out there require an army of consultants to make simple things work. And money-squandering because, while the low-end tools maybe affordable, the high-end tools that you *really* want are just completely and ridiculously expensive. It's perverse.

A meeting of minds

And then, about a year ago, I think, I came across this wonderful talk by Ian Glazer (then at Gartner, now at Salesforce). Here is his talk, or watch it below:


Ian talks about the 3 major problems that the identity management industry faces. Let me paraphrase these:
  • Identity Management is - still - preoccupied with a very static view of the world. It's crazy. People are still trying to automate simple things like create/update/deleting of user credentials, things that add zero to no real business value. IT systems, including Identity Management systems should be more dynamic - should contribute to some kind of competitive business value, shouldn't it? IT for IT's sake - who still does that???
  • Identity management, as a consequence of the point above probably, has very poor business application alignment. Organisations today are really not as much interested in automating INTERNAL processes, only. They know that part - been there done that. Now, the time has come to spend time on the EXTERNAL facing processes. The processes that link our value creation to other, external parts of the chain. Linking with suppliers, partners, customers, etc. That's where the real business value of these systems lies - not internally. And yet, Identity Management struggles to go there. The consequence of this, I believe, is a constant struggle to justify the investment: how do you explain to business people that really they should bring on board an army of consultants for a year to help solve a problem that is not aligned with the business priorities? You don't.
  • Finally: Identity Management is not leveraging real world relationships between people, assets, roles, organisations and security policies. Effectively, people - still, today - manage access as part of a hierarchical view of the world. This of course, we know because Emil keeps explaining to everyone, is false. The world is a graph. You should embrace and leverage it.
Ian's conclusion - if I may interprete it - was that really, the Identity Management industry needs to start over. It needs to be killed, in order to be reborn. And I think, that when it gets reborn, as part of that revolutionary overhaul, graph databases like Neo4j will be a big part of the new incarnation. Here's why.

How can graphs help?

I have been trying to summarize, to the best of my abilities and from a very high level, how Graph Databases will help reinvent Identity Management - when that happens. I believe that there are, effectively, two points that will be of massive help.
  1. Hi-Fi representation of relationships in an Identity Graph: many people have referred to this in other places, but effectively this is all about reducing the "impedance mismatch" of traditional hierarchical access control and identity management systems. Just like many business applications based on Relational Database Management Systems suffer from this problem (and try to patch it up with object-relational mapping band-aids), identity and access management tools try to do this with directories and all kinds of fancy overlaying tools. I believe that to things would no longer be of any use to us, if we were to express the relationships in our Identity Graph appropriately: 
    • We could eliminate the need for separate RBAC systems: Role Based Access Control (RBAC) systems are some of the most complex, tedious to use, difficult to understand, expensive to implement etc etc identity and access management systems out there. They are - no other word for it, in my opinion - absolutely terrible. The concept is great and graph based, but the implementations that I know of are just saddening. If we were to be able to express these Roles, these "cross-cutting concerns" that attribute rights to assets across different parts of the traditional hierarchy, in a graph traversal rather than a complex query and integration over relational and other systems, the world would be so much simpler.
    • We could probably eliminate the need for application specific directories. I know this is a bold statement, and one that was made before when LDAP was first introduced, but I really think this could be true. The reason why Identity Management often times continues to be so difficult is because of the integration problems that are associated with it. These integrations - today - are necessary because of the application specific information that currently is stored in each of the applications. That application specific information currently has to be stored in the application - and not in the central directory - because it would be too difficult to model, insert and query in the traditional hierarchy of those directories. So what if the directories would become graphs instead of hierarchies? Maybe then that need would go away? I know - that will take time. But it is, I think, a valid option and vision for the future?
  2. Real-time querying becomes easy and fast
    • Needless to say, directory servers are good for some things. I remember working with Novell (now NetIQ) eDirectory and it was blazingly fast for some of those typical access control queries. So is Active Directory and OpenLDAP, I assume. But as we discussed above, the new kinds of queries we want are typically multi-dimensional, across different hierarchies, cross-cutting graph traversals - that's the way we want to answer authentication and access questions in the future. Directory servers are not geared to do that. Graph databases are. That's why I think that databases like Neo4j will be playing a big part in this.
I hope that's clear. Maybe it's a little vague now - but hey, that's how revolutions start :)

Useful pointers and next steps

All of the above is why you can find a lot of different examples and materials out there to help you get started with this. There's a couple of things that I would love to point you to.
  • there's a great public case study out there about how Telenor uses Neo4j to do this kind of stuff. Take a look at it over here
  • Wes Freeman recently created a really nice airpair course that is centered around this use case. Very nice and simple.
  • Max De Marzi has written a couple of very hands-on blog posts around permission resolution with Neo4j. Look at part 1, part 2 and part 3 for some code.
  • the awesome Graph Databases Book has a chapter about this as well.
  • I have just done a webinar (recording link to follow) about this as well. Here are the slides:

    The dataset I used to do this can be generated with this gist, and the queries are available over here as well. I have also recorded the demo that I do in the webinar separately - see below:

That's about it for now. I hope this was a useful post for you, and look forward to hearing from you.

Cheers

Rik

Friday 26 September 2014

Another Graph Karaoke: Tom Waits

End of the quarter for me, and instead of biting my nails or pace myself waiting for some of our customers' orders to come in, I thought I would have another go at Graph Karaoke. Still waiting for that new discipline to catch on - but as long as I am having fun, right :)))

Here's the scoop: I have been a longtime fan of Tom Waits. Before Spotify came along, it was was one of the few artists that I basically bought ALL the records off. Good and bad. Actually he never made a truly bad record in my opinion, but that's a different topic :) ... and earlier in the week I came across one of my alltime favourite songs:
Such a wonderful, poetic and funny song - I just love it. The lyrics are over here, and I used these Cypher statements to import the song into my favourite graph database. Then all I had to do was create a little movie to share it with you - so here it is:


The queries that I used in the video, are also on github. I hope you half as much fun listening to it/watching it as I had creating it.

Cheers

Rik

Friday 19 September 2014

Graphs for HR Analytics

Yesterday, I had the pleasure of doing a talk at the Brussels Data Science meetup. Some really cool people there, with interesting things to say. My talk was about how graph databases like Neo4j can contribute to HR Analytics. Here are the slides of the talk:

I truly had a lot of fun delivering the talk, but probably even more preparing for it.

My basic points that I wanted to get across where these:
  • the HR function could really benefit from a more real world understanding of how information flows in its organization. Information flows through the *real* social network of people in your organization - independent of your "official" hierarchical / matrix-shaped org chart. Therefore it follows logically that it would really benefit the HR function to understand and analyse this information flow, through social network analysis.
  • In recruitment, there is a lot to be said to integrate social network information into your recruitment process. This is logical: the social network will tell us something about the social, friendly ties between people - and that will tell us something about how likely they are to form good, performing teams. Several online recruitment platforms are starting to use this - eg. Glassdoor uses Neo4j to store more than 70% of the Facebook sociogram - to really differentiate themselves. They want to suggest and recommend the jobs that people really want.
  • In competence management, large organizations can gain a lot by accurately understanding the different competencies that people have / want to have. When putting together multi-disciplinary, often times global teams, this can be a huge time-saver for the project offices chartered to do this. 
For all of these 3 points, a graph database like Neo4j can really help. So I put together a sample dataset that should explain this. Broadly speaking, these queries are in three categories:
  1. "Deep queries": these are the types of queries that perform complex pattern matches on the graph. As an example, that would something like: "Find me a friend-of-a-friend of Mike that has the same competencies as Mike, has worked or is working at the same company as Mike, but is currently not working together with Mike." In Neo4j cypher, that would something like this
 match (p1:Person {first_name:"Mike"})-[:HAS_COMPETENCY]->(c:Competency)<-[:HAS_COMPETENCY]-(p2:Person),  
 (p1)-[:WORKED_FOR|:WORKS_FOR]->(co:Company)<-[:WORKED_FOR]-(p2)  
 where not((p1)-[:WORKS_FOR]->(co)<-[:WORKS_FOR]-(p2))  
 with p1,p2,c,co  
 match (p1)-[:FRIEND_OF*2..2]-(p2)  
 return p1.first_name+' '+p1.last_name as Person1, p2.first_name+' '+p2.last_name as Person2, collect(distinct c.name), collect(distinct co.name) as Company;  

  1. "Pathfinding queries": this allows you to explore the paths from a certain person to other people - and see how they are connected to eachother. For example, if I wanted to find paths between two people, I could do
 match p=AllShortestPaths((n:Person {first_name:"Mike"})-[*]-(m:Person {first_name:"Brandi"}))  
 return p;  

and get this:
Which is a truly interesting and meaningful representation in many cases.
  1. Graph Analysis queries: these are queries that look at some really interesting graph metrics that could help us better understand our HR network. There are some really interesting measures out there, like for example degree centrality, betweenness centrality, pagerank, and triadic closures. Below are some of the queries that implement these (note that I have done some of these also for the Dolphin Social Network). Please be aware that these queries are often times "graph global" queries that can consume quite a bit of time and resources. I would not do this on truly large datasets - but in the HR domain the datasets are often quite limited anyway, and we can consider them as valid examples.
 //Degree centrality  
 match (n:Person)-[r:FRIEND_OF]-(m:Person)  
 return n.first_name, n.last_name, count(r) as DegreeScore  
 order by DegreeScore desc  
 limit 10;  
   
 //Betweenness centrality  
 MATCH p=allShortestPaths((source:Person)-[:FRIEND_OF*]-(target:Person))  
 WHERE id(source) < id(target) and length(p) > 1  
 UNWIND nodes(p)[1..-1] as n  
 RETURN n.first_name, n.last_name, count(*) as betweenness  
 ORDER BY betweenness DESC  
   
 //Missing triadic closures  
 MATCH path1=(p1:Person)-[:FRIEND_OF*2..2]-(p2:Person)  
 where not((p1)-[:FRIEND_OF]-(p2))  
 return path1  
 limit 50;  
   
 //Calculate the pagerank  
 UNWIND range(1,10) AS round  
 MATCH (n:Person)  
 WHERE rand() < 0.1 // 10% probability  
 MATCH (n:Person)-[:FRIEND_OF*..10]->(m:Person)  
 SET m.rank = coalesce(m.rank,0) + 1;  

I am sure you could come up with plenty of other examples. Just to make the point clear, I also made a short movie about it:

The queries for this entire demonstration are on Github. Hope you like it, and that everyone understands that Graph Databases can truly add value in an HR Analytics contect.

Feedback, as always, much appreciated.

Rik