New, innovative products like DevRev are fascinating. They involve immeasurable quantities of hard work by lots and lots of people to get to market. But once you get there, how do you make it Super Easy(™) to communicate and make your audience understand the fruits of all that work? That. Is. Not. Easy.
This past week I have spoken to so many people, friends and contacts old and new, about this fascinating new adventure that I have embarked on. And I have felt like I really had to iterate multiple times to better tune the message of what it is that we provide to our customers. Communicate. Fail. Rinse and repeat. Until it works. Until it clicks.
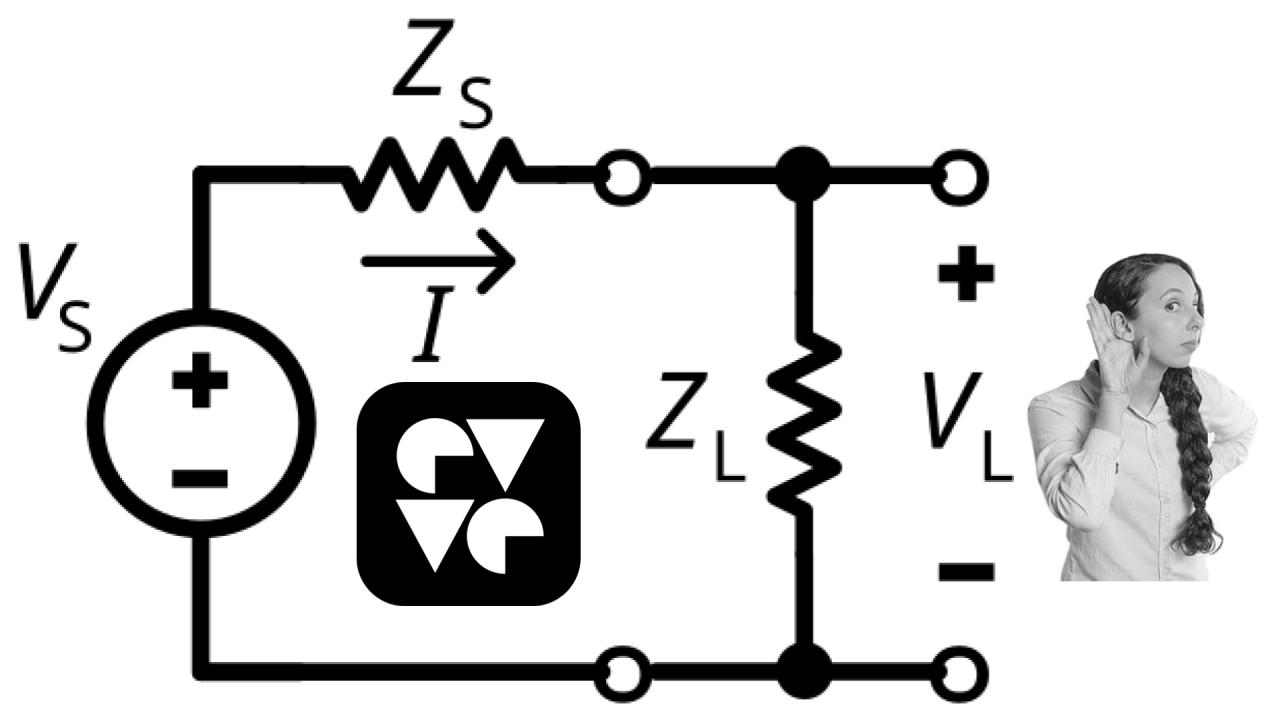
In order to find that “click”, I was thinking of the idea of the Impedance Matching. Those of you that have an engineering background immediately understand: you need to match your messages to the audience that will be receiving it, or else … stuff will get lost :) … Too little detail and people will be frustrated - too much detail and they will be overwhelmed.
So that’s why I started to think about different “levels of communication” for different “levels of audiences” that would understand different “levels of messages” for our different DevRev offerings. Here’s what I came up with.
Industry level - We want to make work matter. We want to connect builders to customers. We want to help build the world’s most customer centric organisations.
These may sound like different objectives - but they aren’t. Especially for people that have seen the complexities of building digital products in today’s day and age, it will probably ring true. How many software engineers never see the fruits of their work in the hands of a customer? How many of them have actually never seen or heard the voice of their customer, literally? That’s not a very satisfying place to be. What if we could shrink that distance between builders and customers? What if we could give builders and buyers, dev’s and rev’s, a true voice in the conversation?
Company level - We want to solve the problem of Information Asymmetry in digital product building organisations: different teams have different access to different information. This problem is the root cause for many Customer Experience problems: siloed teams lead to a frustrating client experience that effectively limits growth.
Great companies excel at customer focus. They are obsessed with their customers’ success, with the value that they derive from the product - and will walk through fire to help the customer get there. There is no substitute for that - but there are lots of barriers to get there. Information siloes are real, in fact they have gotten worse since the moment SaaS 1.0 made it dead easy for every department to automate their departmental processes with yet-another-cloud-platform. Where did the holistic view of the customer go? That’s right - it disappeared. And with it, so did the truly exceptional customer delight.

CxO level - We want to offer new growth opportunities, by enhancing the customer experience at a lower cost. This means breaking down silos between tools and teams, bringing the data together, and using the latest Agentic AI technology to automate the automatable.
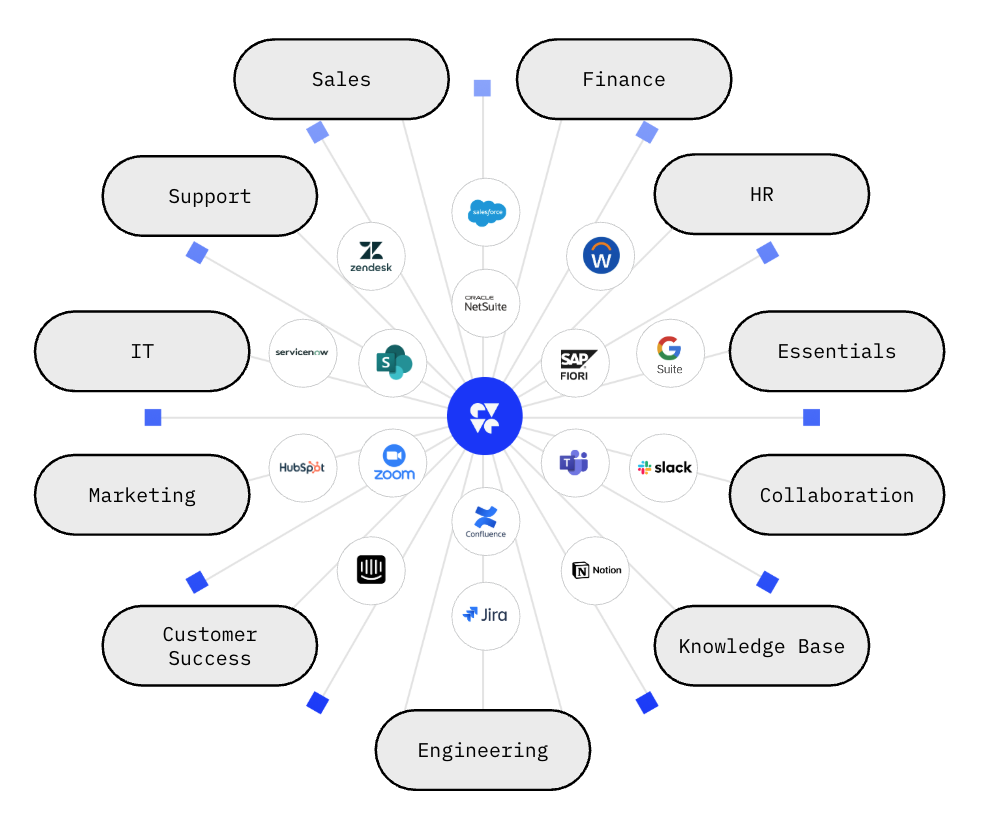
At DevRev, we make this a reality, today, by integrating the different tools in your different departments in a comprehensive Knowledge Graph that connects all the dots. Using that data, we can offer holistic search that reduces the information asymmetry, automated workflows and analytical capabilities on top of that. Using AI, we automate the time-consuming tasks, and make the cross-cutting information accessible through conversational interfaces.
Customer Support - we want you to be able to help more customers quickly and efficiently, using the full information that is needed to do so, and leveraging AI assistance whenever possible.
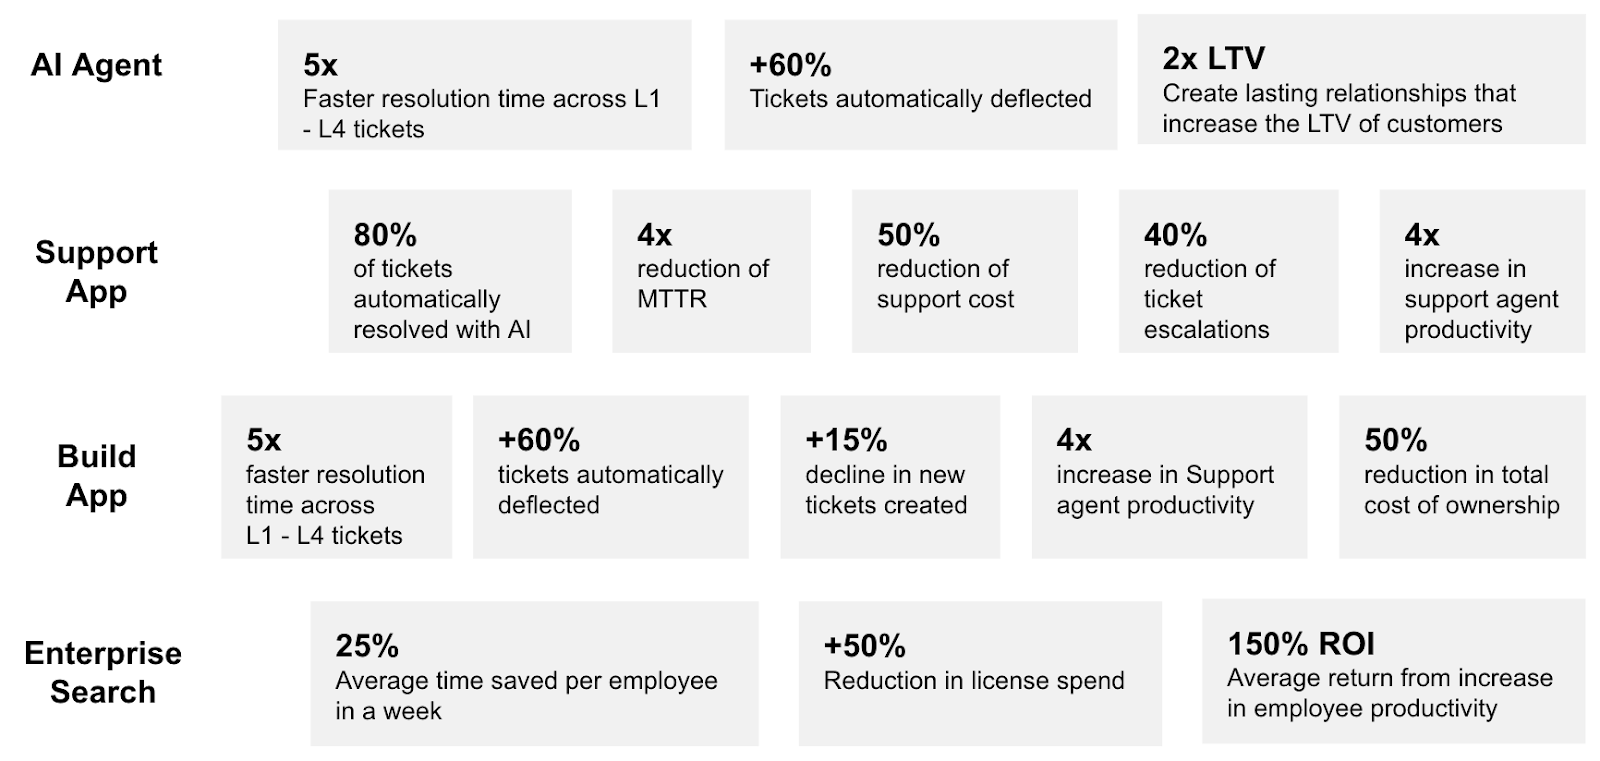
Leveraging DevRev, customers have seen significant drops in resolution times, much higher call deflection rates, faster customer service and as a consequence, a higher net promoter score. As a result, the company can turn support from a cost into a revenue generator.
Product Management - we want to break down the barriers between devs and revs, and make sure that you have all the information to better tune your development and support resources to your most valuable product parts.
Understanding what is wanted and needed by your customers is not trivial, especially when you have layers of Chinese whispers standing between the engineers and their customers. With DevRev’s knowledge graph, a holistic customer view becomes accessible and actionable. With AI, we can aggregate requirements and align your resources. We can tune in to the customer voice, and foster long term success.
Head of data - as digital product organisations become successful, as their departments grow, they become more complex. To deal with that complexity, many organisations have implemented departmental tools to optimize departmental processes - and by doing so we have lost the overall picture. SaaS 1.0 has created data silos - we now face a real data integration challenge.
Using patented “Airdrop” technology, DevRev has successfully implemented a bidirectional syncing system for most sources of enterprise data in the cloud. CRM data from Hubspot or SalesForce, Customer Support data from Zendesk, Freshdesk or ServiceNow, Product data from Jira / Github, it all comes together in a fully synced up Knowledge Graph. This repository is searchable and actionable, and can drive new business processes in real time using AI and AI Agents. This will allow us to lever the holistic view on the data as additional context for better human and AI decision making.
Head of AI - leveraging the potential of AI is on everyone’s radar. Not doing AI is not an option - you do NOT want to fall behind. But how does one operationalise this amazing technology, without spending an arm and a leg and months/years of development time? How do you limit the risk, and ensure compliance? How do you prevent hallucinations and reputational damage?
Turns out you don’t have to do it all yourself. DevRev has spent hundreds of person-years in design and engineering time to build a product offering that does it for you, fast, and at a much lower cost. Leverage the benefits, but don’t run the risks. We help you implement AI efficiently and effectively, and together we will unlock its potential for your organization.
I am hoping that these messages are a bit clearer. We have an incredible story to tell, but it’s like so many beautiful stories: there is more than one storyline. By tuning the story to the listener, by matching the impedance, I have been trying to make it easier to understand - whatever your background.
Looking forward to many more discussions in the next couple of days, weeks, months to come. It’s going to be an incredible journey.
Rik


