Showing posts with label cypher. Show all posts

Monday, 2 August 2021

Summer fun with Musicbrainz: the "real" Six Degrees of Kanye West (part 3/3)

So: now that we have had some fun setting up our local Musicbrainz database (part 1), and importing the data into our Neo4j database (part 2), we can now start having some fun. That means: checking if that actual 6 degrees of Kanye West, and the actual "Kanye Number", is findable and reproducible in our Neo4j database, in an efficient way. Let's take a look at that.

Note: part of this effort was actually motivated by the fact that I have noticed that the python code that powers the above website, actually caches the results (see the github repo for more info) rather than calculate the Kanye Number in real time like we will do here. I guess that speaks to the power of graph databases, right?

But let's take a look at some queries.

Find other artists that worked together with Kanye

Let's start with some simple

match (kanye:Artist {name: "Kanye West"})--(r:Recording)--(a2:Artist)
return kanye,r,a2
limit 100

That gives you a bit of a peek already: Kanye's co-recorders

Summer fun with Musicbrainz: the "real" Six Degrees of Kanye West (part 2/3)

In the first article of this series we talked about our mission to recreate the Six Degrees of Kanye West website in Neo4j - and how we are going to use the (Musicbrainz database)[www.musicbrainz.org] to do that. We have a running postgres database, and now we can start the import of part of the dataset into Neo4j to understand what the infamous Kanye Number of artists would be.

Loading data into Neo4j

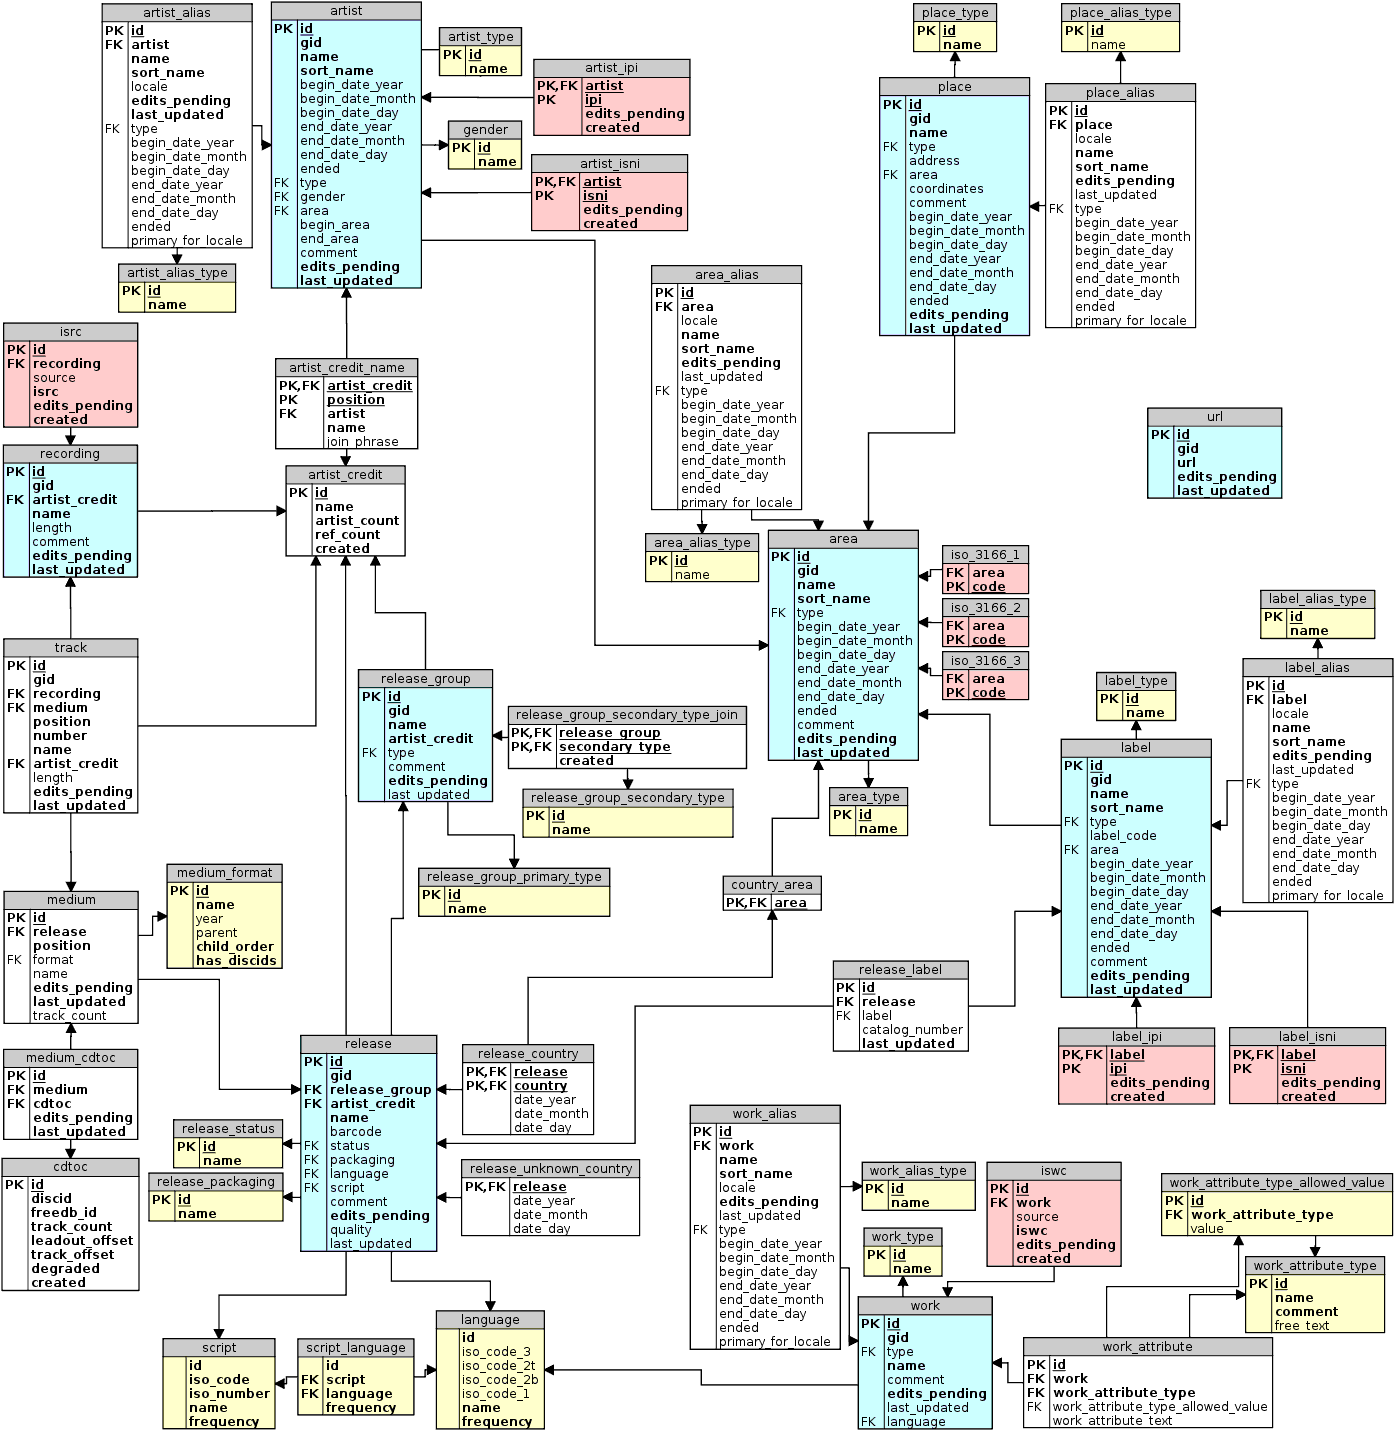
There's lots of different approaches to loadhing the data, but when I started looking at the model in a bit more detail:

  the model

Summer fun with Musicbrainz: the "real" Six Degrees of Kanye West (part 1/3)

Last year, I had a lot of fun working with a fantastic little tool that a colleague of mine created, to analyse and enhance Spotify playlists using Neo4j. While I was working on that blogpost, and I was experimenting with what little I know of Python code, I came across another example project that Spotify actually highlighted on their website: it's called Six Degrees of Kanye West and it's simply amazing.

The idea behind this site seems to be similar to the "Six Degrees of Kevin Bacon": if you have ever worked with Kevin directly, your Bacon Number is 1. If you have worked with someone that has worked with Kevin, then your Bacon Number is 2. Etc etc - and then this is applied to the idea of musicians working together on songs.

For example, if you go there and you look up some unknown artist (like then inimitable Belgian schlager singer, Helmut Lotti), like this:


Monday, 29 March 2021

Part 2/3: Wikipedia Clickstream analysis with Neo4j - queries and exploration

In the previous blogpost, I showed you how easy it was to import data into Neo4j from the official Wikipedia clickstream data. I am sure you would agree that it was surprisingly easy to import a reasonably sized dataset like that, within a very reasonable timeframe. So now we can have some fun with that data, and start applying some graph queries to it. All of these queries are also on github, of course, and you can play around with them there as well.

So let's take a look at some of these queries. 

Some data profiling and exploration

Here's a very simple query to give you a feel for the dataset:

match (n)-[r:LINKS_TO]->(m)
return distinct r.type, count(r);
match (n) return count(n);

The results are telling:

And so now we can start taking a look at some specific links between pages. One place to investigate would be the Neo4j wikipedia page. Here's a query that looks at the source pages that are generating traffic into the Neo4j wikipedia page:

Monday, 8 March 2021

Contact tracing in Neo4j: using triggers to automate actions

Last year I was able to spend some time thinking and writing about Contact Tracing, especially since it should probably be a very important part of any kind of system that allows us to deal with pandemics like the Covid-19 pandemic. You kan find some of these articles on this blog if you are interested. This is still as relevant as ever, but seems to have been a more difficult thing to implement practically in a free and privacy-sensitive society like ours (see this research and this article for some thoughts on this). Nevertheless it seems relevant still, as the Canton of Geneva has demonstrated.

In this article I wanted to share a very short little piece of work that I did together with my colleagues on the part that ACTIONS contact tracing activities. What do we ACTUALLY DO when we find a person that is at risk? What alarms should go off? Who should get notified? Where should we be looking for our next potential patient?

This, I think, is something that we could solve with a "database trigger". This is a systematic way of always reacting to events in the database in a consistent and predictable way. It has been demonstrated a number of times before - I really liked David's way of explaining it in his article on data loading/streaming with Neo4j's triggers. David describes it well:
What’s a Trigger?
If you haven’t worked with triggers before, a trigger is a database method of running some action whenever an event happens. You can use them to make the database react to events, rather than passively accept data, which makes them a good fit for streaming data, which is a set of events coming in.
Triggers need two pieces:
  • A trigger condition (which event should the trigger fire on?)
  • A trigger action (what to do when the trigger fires?)
Triggers are available in Neo4j through Awesome Procedures on Cypher (APOC), and you can find the documentation on them here
So what I want to take you through here is just to take the contact tracing dataset, and show you how easy even a salesperson-lost-in-cypherspace like myself could make it work. So here goes.

Installing and preparing

So the first thing we need to do is to create new database in Neo4j Desktop. Once installed, we should install the APOC plugin, which should be directly available in Neo4j Desktop's "plugins" section. The trigger functionality that we will be using us actually part of the APOC library, and you can find documentation on them over here.

In order to generate the dataset, I will use the Faker plugin again. See the previous blogpost for more on that, but installing that is actually really easy. First we need to download the latest release from github, unzip that file into plugins directory of your freshly baked server, and then manually do a small piece of restructuring in the file structure:

  • put  neo4jFaker-0.9.1.jar in plugins directory
  • and put ddgres directory in plugins directory. 
  • delete all other directories
Once that done, we need to edit the neo4j.conf file so that the faker library will actually be allowed to run inside your Neo4j server. You do that by adding

dbms.security.procedures.unrestricted=fkr.* 

to neo4j.conf. Easy. The file structure should look like this:

And the neo4j.conf should have a line like this.

Once that's done the last change is to allow the apoc triggers to run by adding 

apoc.trigger.enabled=true

to neo4j.conf as well.

Generating the dataset

First thing after starting the database is to fire up the Neo4j Browser, and check if faker library functions are active. That's easy:

call dbms.functions() yield name
with name
where name starts with "fkr"
return *

If it returns with a list of functions, then we are good to go.

Next we just need to run two queries to create the dataset: 5000 persons with 15000 MEETS relationships.

foreach (i in range(1,5000) |
    create (p:Person { id : i })
    set p += fkr.person('1940-01-01','2020-05-15')
    set p.healthstatus = fkr.stringElement("Sick,Healthy")
    set p.confirmedtime = datetime()-duration("P"+toInteger(round(rand()*100))+"DT"+toInteger(round(rand()*10))+"H")
    set p.birthDate = datetime(p.birthDate)
    set p.addresslocation = point({x: toFloat(51.210197+rand()/100), y: toFloat(4.402771+rand()/100)})
    set p.name = p.fullName
    remove p.fullName
);

and then

match (p:Person)
with collect(p) as persons
call fkr.createRelations(persons, "MEETS" , persons, "1-n") yield relationships as meetsRelations1
call fkr.createRelations(persons, "MEETS" , persons, "1-n") yield relationships as meetsRelations2
call fkr.createRelations(persons, "MEETS" , persons, "1-n") yield relationships as meetsRelations3
with meetsRelations1+meetsRelations2+meetsRelations3 as meetsRelations
unwind meetsRelations as meetsRelation
set meetsRelation.starttime = datetime()-duration("P"+toInteger(round(rand()*100))+"DT"+toInteger(round(rand()*10))+"H")
set meetsRelation.endtime = meetsRelation.starttime + duration("PT"+toInteger(round(rand()*10))+"H"+toInteger(round(rand()*60))+"M")
set meetsRelation.meettime = duration.between(meetsRelation.starttime,meetsRelation.endtime)
set meetsRelation.meettimeinseconds=meetsRelation.meettime.seconds;

That finishes in seconds.

And then we end up with a very simple graph data model:


Now we can start asking ourselves how we can take these automatically triggered actions based on database triggers. So let's explore that.

Working with triggers

As mentioned above, you can find the documentation for the trigger procedures and functions over here. Once the configuration flag is set (apoc.trigger.enabled=true) in neo4j.conf, we can add the triggers to the database, and start testing them. so let's add them first.

Adding two triggers

You will find that there are different types of triggers that you can add. I will explore two types in this post:

  1. a trigger that will fire as soon as a LABEL is added to a node in the database.
  2. a trigger that will fire as soon as a property is set in the database. 
The structure and process of adding the triggers is very similar and simple. Let's walk through it.

First we will be  adding the CHANGE LABEL trigger to the database - we call this trigger "highriskpersonadded":

CALL apoc.trigger.add(
'highriskpersonadded',
'UNWIND apoc.trigger.nodesByLabel($assignedLabels,"HighRiskPerson") AS n MATCH (n)-[:MEETS]-(p:Person) set p:ElevatedRiskPerson'
,{phase:'after'}
)


Next we are adding a CHANGE PROPERTY trigger to the database - we call this trigger "healthstatuspropertychangedtosick":

CALL apoc.trigger.add(
'healthstatuspropertychangedtosick',
'UNWIND apoc.trigger.propertiesByKey($assignedNodeProperties,"healthstatus") AS prop
with prop.node as n
MATCH (n)-[:MEETS]-(p:Person) where n.healthstatus = "Sick"
set p:MuchElevatedRiskPerson'
,{phase:'after'}
)


Once these have been added to the database, we can start working with them, and test them out.

Managing the triggers

There's a number of procedures that allow us to see which triggers have been added, and which are active:
  •  Listing the trigger:

    call apoc.trigger.list()
  • There's another procedure for removing the trigger:

    call apoc.trigger.remove('<name of trigger>')

  • And one for pausing the trigger:

    call apoc.trigger.pause('<name of trigger>')

  • Or resuming the trigger:

    call apoc.trigger.resume('<name of trigger>')
But now, of course, we want to see what happens to our database when the triggers start firing. Let's explore that.

Triggering the triggers

The first thing that we will do is we will write a cypher query that will trigger the CHANGE LABEL trigger. We do that by selecting one person and assigning the "HighRiskPerson" label to that node:

match (p:Person {healthstatus:"Healthy"})
with p
limit 1
set p:HighRiskPerson;

This quasi immediately completes:


And then we immediately see that our Neo4j browser reacts by highlighting the fact that some new labels have been added to the database.


And then we run a quick query to see that indeed, the HighRiskPerson node has been connected to other nodes that have the ElevatedRiskPerson label:


So our first trigger is clearly working. Let's try the other one.

We will now triggering the CHANGE PROPERTY trigger by at the same time set a new label (VeryHighRiskPerson) and setting the healthstatus property to "Sick".

match (p:Person {healthstatus:"Healthy"})
with p
limit 1
set p:VeryHighRiskPerson
set p.healthstatus = "Sick";

That finishes immediately, of course.


And next thing we know, we also see that the VeryHighRiskPerson and MuchElevatedRiskPerson labels have been added:


So that all seems to have worked. This really allows for much more automated actions on the database, which could be extremely useful in a sensitive use case like Contact Tracing - but I could equally see how this would be super useful for use cases like Fraud Detection or something similar.

Hope this useful for everyone. All the code in this example has been published on github, of course. If you have any feedback, please reach out.

All the best

Rik
Wednesday, 23 September 2020

Exponential growth in Neo4j

With the current surges of the Covid-19 Pandemic globally, there is a huge amount of debate raging in our societies - everywhere. It’s almost as if the duality between left and right that has been dividing many political spectra in the past few years, is now also translating itself into a duality that is all about more freedom for the individual (and potentially - a higher spread of the SARS-CoV-2 virus), versus more restrictions for the individual. It’s such a difficult debate - with no clear definitive outcome that I know of. There’s just too many uncertainties and variations in the pandemic - I personally don’t see how you can make generic statements about it very easily.

One thing I do know though, is that very smart and loveable people, in my own social and professional circle and beyond, seem to be confused by some of the data. Very often, they make seemingly rational arguments about the numbers that are seeing - but ignoring the fact that we are looking at an Exponential Growth problem. In this post, I want to talk about that a little bit, and illustrate it with an example from the Neo4j world.

What is Exponential Growth exactly?

Let’s take a look at the definition from good old Wikipedia:
Exponential growth is a specific way that a quantity may increase over time. It occurs when the instantaneous rate of change (that is, the derivative) of a quantity with respect to time is proportional to the quantity itself. Described as a function, a quantity undergoing exponential growth is an exponential function of time, that is, the variable representing time is the exponent (in contrast to other types of growth, such as quadratic growth).
The basic functions that are being entertained here are very simple in terms of the maths:


Tuesday, 10 April 2018

Podcast interview with Johan Teleman, Neo4j

I had a great time chatting to my colleague Johan Teleman, recently. Johan works at the Neo4j Engineering team in Malmö, and has been doing some great work - on Cypher performance among other things. As it turns out, there's a LOT that has been done already (look for some spectacular stuff in Neo4j 3.4), but there are so many interesting plans for the future as well. Here's our chat:


Here's the transcript of our conversation:
RVB: 00:01:39.301 All right. Hello, everyone. My name is Rik, Rik Van Bruggen from Neo4j, and here I am again recording another episode for our Graphistania podcast. And today I am very happy to have one of my Malmö colleagues on the other side of this call. That's Johan Teleman. Hi, Johan. 
JT: 00:01:59.902 Hi, Rik. Happy to be here.

Wednesday, 17 May 2017

Podcast Interview with Darko Križić, Prodyna

Another stupidly late podcast publication on my behalf. Somewhere early March (yes, I KNOW - dammit!!!) I had a great conversation with one of our prime Neo4j partners in Germany and across Europe these days, called Prodyna. We did a couple of events together, and I found that some of their thinking and case studies really aligned very well with my own. So we got together for a chat. It's a bit annoying because both of us were referring and looking forward to GraphConnect - and I clearly missed that deadline/timeline. But still wanted to share the conversation... Here it is:
 As per usual, here's the transcript of our conversation:
RVB: 00:02.689 Hello, everyone. My name is Rik, Rik van Bruggen from Neo Technology, and here we are again recording another podcast, a little bit closer to home. It's actually a really special podcast for me because it's exactly two years ago since we started it on request or instigation of my dear friend Michael Hunger. And this week we've invited someone from Germany in order to talk a little bit about of the wonderful things that PRODYNA is doing with Neo4J. And that's Darko Krizic from PRODYNA. Hey Darko, how are you? 

Thursday, 23 February 2017

Podcast Interview with Gábor Szárnyas, Budapest University of Technology and Economics

Waw. That was probably the longest stretch that I went without publishing blogposts or podcasts over here. I have no real excuse - the start of 2017 has just been super busy and interesting - with a lot of travel that does not really help with quiet "writing" time. But it's all great fun - I just need to get back into the rhythm - and today is the start of that.

Today's podcast is actually super cool. It started at a beautiful Brussels bar after Fosdem. At this conference, there have been "graph devrooms" hosted for the past couple of years - and this year it was a really nice lineup.  One of the speakers, Gábor, did this really interesting talk about "Graph Incremental Queries with OpenCypher", which is really cool. So after the conference, it turned out we share a passion for cycling too - and we decided to get together for a nice recording. Here it is:


Here's the transcript of our conversation:
RVB: 00:04.202 Hello everyone. My name is Rik, Rik Van Bruggen from Neo Technology and I must confess I feel very, very guilty now because this is the first time that I'll be recording a podcast in 2017, so happy new year. In spite of the fact that it's Valentine's Day. But yeah, I was slacking a little bit but I want to bring the podcast back to life and I've lined up a bunch of people to help me with that. And today I've invited someone who I've who only met like two weeks ago at the FOSDEM Conference in Brussels. And that's Gábor Szárnyas from Budapest. Hi Gábor. 
GS: 00:42.680 Hi Rik. Nice to be here. 
RVB: 00:43.500 Hey. Thank you for joining me. It was a great time meeting you in Brussels over some Brussels beer, but yeah we talked to each other about your work and I thought it would be great to have you on the podcast. So my first question is going to be who are you, and what do you do? What's your relationship to the wonderful world of graphs? 
GS: 01:10.158 Okay. So I'm a researcher at Budapest University of Technology and Economics. And also visiting researcher at McGill University in Canada. Now I'm working on finalizing my PhD, so hopefully I will be finish it within a year or a half. And I worked basically on graph- related topics in my PhD. 
RVB: 01:33.134 Oh, very cool. And don't forget you share another passion with me. 
GS: 01:38.380 Yeah, I'm also a cyclist. 
RVB: 01:40.152 Yes, exactly. 
GS: 01:40.729 So I started road cycling three years ago and it absolutely wondered me. I really like cycling-- 
RVB: 01:49.279 Same for me...
GS: 01:50.351 --and that's my main passion. 
RVB: 01:51.948 Same for me. We have a couple of other graphistas that are super passionate about cycling so we'll have to do a ride sometime. But tell us-- 
GS: 01:59.412 I agree. 
RVB: 01:59.558 --a little bit more about your work with graphs. What's it all about, what's your PhD about, and what are you working on? 
GS: 02:07.503 Okay. So my PhD revolves around three topics that are related to graphs. The first one is how to incrementally query graphs. So imagine that you have a complex query and you have a huge graph. Now obviously, it's very difficult to evaluate a query on the graph at a very short amount of time. So basically, as a workaround, we do incremental queries, which means that if your graph changes slightly then we maintain the result sets. And this is useful for a number of scenarios. You can use it for static analysis of code bases, you can use it for runtime modelling, you can use it for fraud detection, and so on. There are many use cases that present this scenario. 
GS: 02:52.025 The second topic of my PhD is how to benchmark an incremental graph query engine. Because, obviously, once you have an incremental graph query engine, you would like to have some feedback on its performance. And you would like to use that to continuously improve your query engine. So, with my research group, we designed and implemented a framework that allows users to do just that. Compare incremental graph query solutions to each other and to other competitors. 
GS: 03:22.765 And the third one-- yes? 
RVB: 03:22.870 Is that related to the LDBC work, the Linked Data Benchmarking Council, is that related to that? 
GS: 03:30.529 So basically they have similar goals. I was actually at Walldorf last week at LDBC Technical User Community Meeting. And LDBC has a couple of benchmarks, but currently none of those covers incremental graph queries and complex graph pattern matching. I talked to the LDBC guys and also attended the talks, and it seemed that there will be a new LDBC benchmark, which will have similar goal than my benchmark. And that will be called the Business Intelligence workload for the Social Network Benchmark. And the problem with that is that it's not yet ready. So I talked to it's core developer, Alex Averbuch, and he said that it will be ready within half a year but they are still heavily working on it. 
RVB: 04:29.082 Okay. But you had said that you had three goals, right? You had the incremental queries and then the benchmarking and what was the third one? 
GS: 04:34.976 The third one is closely related to network theories. A network theory is something that came up in the late '90s in the early nodes when people started to analyze graphs. So they took a graph of people where the nodes were the people in a community and the relationships were if they were friends or not. Or they took the graph of the World Wide Web where the nodes were the web pages and the relationships were the links between the web pages. So they took all these graphs and started to analyze them, and they derived very interesting properties, chief among which was the scale-free property of graphs. There are many papers on scale-free networks, and they discovered that this is very common in biology, in sociology, also in physics and other sciences. 
RVB: 05:28.488 What does that mean, scale-free networks? What does that mean?
GS: 05:30.744 So basically scale-free network means that the degree of distribution of the nodes follow the so-called power law. So you have very few central hubs. And basically, if you remove these hubs from the network then your network will break down to smaller components. And they discovered that this is how societies are organized, this is how citation networks work, and this is how power grids work as well. 
RVB: 06:00.783 Oh wow. Just like a universal structural characteristic of lots of networks. 
GS: 06:06.958 Yes, lots of networks. Obviously you cannot apply to all of the networks but it was a very big surprise to the scientists who worked on it that a lot of networks exhibited this property. So how does my PhD research relate to that? Well interestingly, there wasn't much work performed on tide graphs. So if you see Neo4j graphs, you obviously see that you don't only have people and websites and books, but you have all these inner single graphs. So you have tide graph, and they also have different relationships between them. And only in the last five to ten years have been there research about how to characterise these graphs. These have many interesting names. Some people call them the multiplex networks, others call them the multidimensional networks or multilayered networks. Analysing these is very tricky because obviously you have another dimension of complexity by having to deal with all the types of the nodes and the relationships in the graphs, but it's kind of a green area and you can do a lot of interesting work in it. I actually applied it to engineering models, so my research group works in model driven engineering. And there are engineering models for software, hardware, state machines, system design and so on. And basically we took all these models and analyzed them and we looked for some interesting properties. 
RVB: 07:58.123 Wow. 
GS: 07:59.168 We didn't find any huge results so we didn't find that these models are scale-free or they follow some very famous distribution. But we did have some interesting results on how to characterize these models. 
RVB: 08:18.190 Wow, very cool. So could you tell us a little bit more about how you got into the graph business, or the graph science if I may call it that way? How did you get into it, and why did you get into? 
GS: 08:35.661 Okay. Well, that's an interesting question. I think it started in 2011 when I had to pick my first individual research topic at my university, and my roommate
suggested that I should give a try to node secure databases. I was already very interested in anything that's related to databases, relational or not. So I started to work on node secure databases. And then I soon discovered Neo4j and the property graph data model. And I think what really struck me is how intuitive the graph data model is. There is actually a paper by Marko Rodriguez, who was the implementer of the TinkerPop framework, and he said that graphs are very intuitive because they describe the way that people use when thinking about the world. So people tend to abstract the world as things that are somehow connected. And you can perfectly describe this with graph nodes and graph relationships. So this is something I really like about graphs. And that's something that you also mentioned in this podcast, I think a couple of times, that you can use a whiteboard and then just start brainstorming, and having ideas, and drawing a graph. And you can use pretty much the same graph in your applications as well. So that's my favourite thing. 
RVB: 10:07.046 Jokingly, I always talk about my own acronym, which is WYDIWYS, what you draw is what you store. 
GS: 10:14.439 Yeah, that's a catchy acronym actually. 
RVB: 10:18.913 It's been repeated so many times on this podcast but it is a very big strength of graphs, right? The model is so intuitive and so descriptive, so rich, really. That makes a whole lot of difference, right? So I'm reading that that's also how you got into it, right? That's also why you think it's very valuable? Is that right? 
GS: 10:43.860 Yes. So basically after I got a bit familiar with the topic, I started my master's at university. And already during my master's I was working on the incremental query engine that I'm still working on today. So it's quite a long project. I've been doing this for five-plus years. And I really liked my experience during the master's so I joined the PhD and I just finished PhD school three weeks ago. So now it's only-- 
RVB: 11:11.500 Congratulations [laughter]. 
GS: 11:13.087 Thank you. So it's only up to me to publish some more papers and polish a dissertation. 
RVB: 11:21.283 So what does the future hold, Gabor? Where is it going for you personally? Where is your research taking you, but also how do you look at this taking ground in the broader industry? What's the future hold if you had a crystal ball? 
GS: 11:36.571 So, I would really like to be an academic. I really enjoy working at university because you have so many positive experiences with students. You can pretty much follow your own dreams and do research in almost whatever interests you the most. Obviously you have to fit within your grant proposals and your funding but this still gives you a lot of way to be creative and I would like to be a university lecturer and researcher in the future. So that's my kind of dream career. And-- yes? 
RVB: 12:17.317 And is it lecturing and teaching about graphs then or is it on a broader topic or is it computer science or what will be the topic then? Or topics? 
GS: 12:26.893 Well, I'm pretty much happy to teach anything relates to computer science, so I've taught topics from database theory to automata theory, system modelling, and software engineering topics, and also some laboratories on actual technologies. So our university is a bit of a mix between computer science and computer engineering. So we teach both theoretical and practical stuff and this is something that I also really enjoy. 
RVB: 13:01.647 Super. And what about the wonderful world of graphs and graph databases, is there anything like that in your future you think? 
GS: 13:10.251 Yes. So I really would like to get a version of my graph query engine that can be used by other researchers. I obviously understand that implementing production-grade software is not really possible within the limits of a PhD. But I would like to release a system that can be used at least by other researchers, both in academia and both in industry. I talked to a lot of people about this and it seemed that people would actually be interested in trying such a system, or benchmarking such system, and see how it works for their use cases. 
RVB: 13:49.818 Super. So final question, what's your favourite cycling destination? 
GS: 13:54.706 Ooh, that's a tricky question [laughter]. 
RVB: 13:56.737 Curveball for you. 
GS: 13:56.958 But actually, it's not a very common answer. I live next to the Hungarian-Austrian border, so I do go a lot to Austria because Austria has the best roads in Europe, and also most of the country is the Alps. So I live next to the lower Alps section, but even there you have very nice hills, and drivers are really polite, and you have these super flat tarmac all over the country. And that's what I really enjoy and I'm really looking forward to the summer. So I just usually disappear from the university for a couple of weeks and then go home and cycle. 
RVB: 14:38.375 Excellent. So no cobblestones for you? Unlike Flanders Classics or something like that? 
GS: 14:44.387 I actually really like riding the [inaudible], so I live in the inner historical district of Budapest and we still have a lot of cobblestone roads. And when I just started cycling in Budapest just to get to work and commute I usually tended to avoid those sections. But since I'm more into cycling I just go for the most cobblestoney sections [laughter]. This is something that you learn to enjoy or at least you think you enjoy it. 
RVB: 15:16.963 Yeah, yeah. Exactly. Very, very cool. All right. Well, I hope we get to ride one day together, that would be great. I really enjoyed this conversation. Thank you for taking the time. And I look forward to meeting you again someday, at FOSDEM or somewhere else. 
GS: 15:32.360 Thank you, for an invitation and we should definitely go for a ride. 
RVB: 15:36.138 Absolutely. Thank you, Gábor. 
GS: 15:38.717 Thanks. Bye

Subscribing to the podcast is easy: just add the rss feed or add us in iTunes! Hope you'll enjoy it!

All the best

Rik

Friday, 2 December 2016

Exploring the Paris Terrorist Attack network - part 3/3

Previously, on this blog, I had started writing about how we could get some of the data published by a local Belgian newspaper, De Standaard, on the Paris Terrorist Attack Network into Neo4j. In
  • Part 1, we talked about loading the raw JSON data into Neo4j, and then in
  • Part 2, we cleaned up some of the data for easy querying in Neo4j. 
So that's where we are. To wrap things up, I just wanted to illustrate some of the results and queries in Neo4j around some of the most interesting figures in this Terrorist network. I started some of my explorations around a widely reported terrorist, and Belgian national, called Salah Abdeslam.


So let's take a look at Salah in Neo4j.

Wednesday, 30 November 2016

Exploring the Paris Terrorist Attack network - part 2/3

In part 1 of this blogpost series, we got the basic Paris Terrorist Attack Network loaded into Neo4j. It looked like this:
There's a couple things that annoyed be about this graph:

  1. First, the relationships are all "bidirectional", which really clutters the visualisation. In Neo4j, relationships are always directed, which kind of makes it awkward to store these bi-directional relationships like this. 
  2. Of course, this graph was originally made by De Standaard newspaper in Flanders, Belgium, so therefore it was created in Dutch. A couple of the key concepts though (type of node, status of the node) would be easily and meaningfully translated for you to have any fun with the dataset.
  3. The graph was not "labeled", and therefore lacked some essential structural elements that would allow for fun manipulation in the Neo4j Browser. 
  4. The relationships did not really say anything about the type of relationship. 
Let's tackle these one by one.

Monday, 28 November 2016

Exploring the Paris Terrorist Attack Network - part 1/3

November 13th, 2015 - A day to remember

Just over two weeks ago, we remembered the sad anniversary of one of the most atrocious and vile terrorist attachs that our generation has seen. It's easy to forget many things in our daily rat race, but I don't think I will easily forget this video, which was all over the internet hours/days after the attack on the Bataclan concert hall in Paris:

All it takes is a drop of empathy and humanity to understand the horror that these victims went through. The sound of the one person shouting "Oscar .... Oscar... Oscar..." just keeps on ringing through my head.

Friday, 25 November 2016

Podcast Interview with Craig Taverner, Neo Technology

The interview below was long overdue - but very much worth the wait. For the past couple of years, the Neo4j community has been brewing on a really interesting add-on capability to integrate GIS-style, spatial querying capabilities into Neo4j. It's such a great and natural fit - and one of the driving forces behind this in the community has always been this global citizen called Craig Taverner. Craig has been in the ecosystem for years - first as a community member, then as a commercial customer, and now as an employee in Neo's Swedish engineering team. So about time we had a chat:

Here's the transcript of our conversation:
RVB: 00:02.785 Hello everyone. My name is Rik, Rik Van Bruggen from Neo Technology, and here we are again, recording another Neo4j Graphistania podcast session. And today I'm joined by one of my colleagues actually, in the Neo4j engineering team, Craig Taverner. Hi Craig.

Wednesday, 31 August 2016

Podcast Interview with Dirk Vermeylen, HP Enterprise

Last month I had the pleasure of interviewing one of my fellow countrymen, a Belgian graphista living a short distance from my home in Antwerp, who had submitted a very cool graphgist to our challenge earlier this year. Dirk Vermeylen did a great gist about trying to model sports results as a graph database - very interesting, so I will let him explain it to you himself. Here's the recording of our conversation:
Here's the transcript of our conversation:
RVB: 00:02.538 Hello everyone. My name is Rik, Rik Van Bruggen from Neo Technology and I am here again recording a podcast episode with someone in my own country. That's actually very, very-- I don't think that's happened before. Dirk Vermeylen, from HP Enterprise is joining me from a couple of miles down the road on our phone call. Dirk, welcome. 
DV: 00:23.708 Thank you, Rik. Thanks. 
RVB: 00:25.290 Cheers. Thanks for coming online. Dirk, we got to know each other because of some GraphGist that you created recently which we'll talk about more a little bit later, but why don't you introduce yourself to our listeners first of all? 
DV: 00:41.285 I am working for HPE, used to work for EDS. So that was taken over by HP then became HPE and there is some changes in the future as well. I work as a consultant in the service delivery and infrastructure environment. 
RVB: 01:04.137 Okay and then what's your relationship to the wonderful world of graphs? How do you get into that if I may ask? 
DV: 01:13.628 It is more or less by accident. I am-- as part of service delivery and a lot of work is done on configuration databases on CMDBs, where what we need to do is migrate CMDBs and varying CMDBs on for example, what is important is you want to know what service are implemented in specific data centers and what applications are related to it. There are many, many relations in between like server databases that are installed and instances at business services that are configured to it, so you only have all sets of relationship. We need to work with it and I was looking into better ways on how we can manage the data on it. Then Neo4j was mentioned when reading the internet, so at some point in time I thought I may get this a try. I did it and it worked in fact, [?] though. 
RVB: 02:18.972 I think there's a lot of people out there that are using Neo4j for configuration management databases because of the relationships and review and the impact analysis that allows you to do. So, if something happens in your configuration, what's the impact on the rest of the configuration. Is that also your case or was that your background as well? 
DV: 02:41.301 Exactly. Exactly. And the advantage is that when you do queries, actually Neo4j allows to document and very well decipher way of working is the very nice way of documentation. It reads easier than you do with complex SQL queries whereas we join and all of that that's a bit more tricky to understand what you have been doing a couple of days later. 
RVB: 03:05.779 Absolutely. I have so many people that talked to us about that. That's great to hear. But you ended up writing that GraphGist for something completely different, right [chuckles]? What was that all about? It was about your running partners, right? 
DV: 03:21.132 That's right. I was working on CMDBs also a little bit in my free time. At some point you have done and you're ready with it. At that time the GraphGist challenge appeared and it says try to do this problem if you can do it on a wide board, it will work. In my free time I tried to collect information about our running competition which is just like we go running with a couple of friends. And first at the rising in the race gets 50 points, second 45, third 40 points, and so on. And then we just add them all up together and at the end of the year you have a winner for motivation. We keep track of this points in the Excel spreadsheet. I want to automate it because automation is fun. And I tried to make a big draw. The problem-- and it worked very well at the same time as the GraphGist challenge, so I thought probably I should spent a little bit more time and work on this GraphGist challenge. 
RVB: 04:33.723 Super cool. We'll put a link to your actual GraphGist on the blog post with this episode as well. What was so nice about it? What was it that made the GraphGist and Neo4j such a good fit for that particular running assignment that you wanted to solve? 
DV: 04:53.803 GraphGist was easy to use, and you need the AsciiDoctor which is like-- you take notes-- part plain text and then with very little markup or markdown, as it was called, you can specify query. And see the results actually directly in the GraphGist. And Neo4j is very visual so you create-- when one query, you see a little bit of the dots already and you say "Ah, I need a second query." And from the second query you go to the third query. So, it's very visual. It allows you to very quickly progress in your problem fields. 
RVB: 05:36.505 Very, very nice. I bet your running buddies were happy with the result [chuckles]. 
DV: 05:44.441 I didn't show it to them already. Part of the thing is that I used test results which means the races are correct, the people are correct, but the sequence of rival is not correct in the GraphGist. So I'm not sure if they will be so happy with me what I assumed there. 
RVB: 06:05.157 You made yourself win every time [laughter]. 
DV: 06:08.787 No. Not me. Someone else. But it's-- really it's test data. 
RVB: 06:13.784 I understand. Very cool. All right. So what are you going to use this for in the future, Dirk? Do you have any more professional or personal plans with this? Or where do you want to take this in the future? 
DV: 06:26.347 And part of the GraphGist as well was to get more experience with cypher and I used it for CMDB to challenge with configuration management databases that you have like 20,000 objects and 18,000 relations. So if you launch a query, it may or it may not end up with the result that you are expecting because of lack of experience. With my very small example, it's a lot easier to understand what you are doing. And where I want to take it in future is configuration management databases, of course. Also, on open data-- I'm more and more involved in open data. And open data is all about linked data. And with linked data, you are very close to Neo4j and these graphical relations again. 
RVB: 07:19.085 Super. Well, I mean, I think we will meet again there. Because that's exactly the type of stuff that I've been working on in the meetups here in Belgium as well. And I'm sure we'll have a chat about this in the future then. Very cool. Anything else you want to add, Derrick? Is there anything that would should be paying attention to in your work? Or otherwise, I think we'll keep this podcast recording short. 
DV: 07:45.950 That's perfect. I'm happy with what Neo4j was doing already. I was working on Neo4j version two. And py2neo is very important. The py2neo library. I had a little bit of issues that I've seen-- that the new version of Neo4j and the new version of py2neo solve them all. So I'm looking forward to play around with these. 
RVB: 08:10.485 Well, it's summer time. You know, this is perfect time to experiment with those [crosstalk]. 
DV: 08:16.662 Exactly. 
RVB: 08:16.236 All right, Dirk. Thank you so much for sharing your work with us and with the entire community. I really appreciate it. And thank you for coming online to do this recording. And I'm sure we'll meet very soon. 
DV: 08:28.730 Thanks, Rick. Thanks. It was nice doing this. 
RVB: 08:30.685 Thanks a lot. Bye. 
DV: 08:31.662 Thanks. Bye.
Subscribing to the podcast is easy: just add the rss feed or add us in iTunes! Hope you'll enjoy it!

All the best

Rik

Wednesday, 17 August 2016

Podcast interview with Stefan Plantikow, Neo Technology

Today's episode in the Graphistania podcast is one that I have really been looking forward to, for many reasons. First of all, our guest is such a lovely guy - feels like I could go out on a VERY long pub crawl with Stefan - seriously. Then, he has been working on some of the most interesting topics in Neo4j - another bonus. Most recently, he has worked on the "swiss army knife" of Neo4j tooling, the Awesome Apocs. Enough reason to have a good podcast chat together - and here that is:


Here's the transcript of our conversation from July 4th, 2016:
RVB: 00:02.518 Hello everyone, my name is Rik, Rik Van Bruggen from Neo, and here we are again, recording another Graphistania podcast, and today I have one of my lovely colleagues from the engineering team with me, Stefan Plantikow from Berlin. Hi Stefan.

Wednesday, 10 August 2016

The Great Olympian Graph - part 2/3

In the previous blogpost of this Olympic series I explained how I got to the dataset in 4 distinct .csv files that get generated from a 4-worksheet Google Spreadsheet. Here are the links to the 4 sheets:
Now, in order to load that data into Neo4j, I had to come up with a meaningful graph model.

Wednesday, 29 June 2016

Podcast Interview with Andrès Taylor, Neo Technology - reloaded

Two months ago, me and my friend Andrès where chatting on our internal slack channel, mesmerising about how cool our customers are and how we get the best possible feedback from talking to them. So how could we talk more too them? Simple: two weeks ago, me and Andrès went on a little road trip together, hitting Amsterdam, Paris and London in three days, talking about all the things we love talking about - but primarily, of course, Andrès' baby, Cypher. There's been a lot going on the Cypher world in the past few years - and it felt like a good time for a "reload" of the interview we did last year. So here it is - from a noisy London coffeeshop, to your podcast player:

Here's the transcript of our conversation:
RVB: 00:01 Hello, everyone. My name is Rik, Rik Van Bruggen, from Neo Technology, and here I am in a beautiful London coffee shop recording a podcast with someone that I've been speaking to a lot in the past couple of days because we've been doing a little road trip through Europe about openCypher. That's Andres Taylor. Hi, Andres.

Thursday, 16 June 2016

Roadtripping for openCypher

This week, me and Andrès Taylor have been on the road to talk to our beloved Neo4j community about openCypher, our effort to deliver a full and open specification of the industry’s most widely adopted graph database query language: Cypher. It's been a fun and crazy couple of days, with Amsterdam on Tuesday, Paris on Wednesday - and today, I believe is Thursday so we must be in London :) ... We are doing a similar talk tonight in our London office...

Thursday, 10 March 2016

Podcast Interview with Alberto Perdomo, GrapheneDB

Another week, another great podcast episode. This time, I spent a very nice 15 minutes talking to an "age-old" community member for Neo4j: Alberto Perdomo, from GrapheneDB. Alberto has been developing a very well-respected cloud hosting offering around Neo4j from one of the nicest spots, Gran Canaria, in Spain. He has lots of experience with Neo4j, and a really great insight into how the cloud market is going to be developing for the graph space - so definitely worth a good listen. Here goes:
Here's the transcript of our conversation:
RVB: 00:02 Hello everyone, my name is Rik, Rik Van Bruggen from Neo Technology and here I am again interviewing a lovely community member all the way from Gran Canaria Spain, Alberto Perdomo from GrapheneDB. Alberto, so nice to have you on the call. 
AP: 00:18 Hi Rik, thanks for having me. 
RVB: 00:21 It's super great to have you here. You've been one of the prime and most visible community members for Neo4j for as long as I can remember because you've been doing GrapheneDB, but most people won't know you yet. So why don't you introduce yourself? 
AP: 00:37 Yes, my name is Alberto Perdomo and I'm the cofounder and CEO of GrapheneDB. And GrapheneDB itself it's a fully managed cloud hosting service for Neo4j. So it's basically a service that runs Neo4j for you on AWS, on Microsoft Azure and so on. 
RVB: 00:59 Wow. Now how long have you been doing this? 
AP: 01:02 We started in 2012. But early on it was just proof of concept, prototypes and so on. And in 2013, we started with an early private [bedder?] and started inviting users to try out the service. And then eventually, it took us quite some time but at the end of 2013 we started having our first paid customers. In 2014 we went GA, so that means the service went publicly available. 
RVB: 01:42 That's quite a ride. I've been using it myself in the sandbox. I love it for demos and little things that I write about, so thank you for providing that. 
AP: 01:53 It's great. There's all sorts of use and every time I meet someone I'm surprised by the use cases. Some people use it just for prototyping, throw away databases. Like you for example, you use it to prepare you some sample data sets and other people use it for all sorts of things that are hobby, projects, and all kinds of production employments, everything. 
RVB: 02:23 So just out of interest, how many instances are you running on a normal day? Any idea? 
AP: 02:30 Running on a normal day, I don't know. We have this thing where we actually stop databases, some sandbox databases which are free and which are not in use, they are stopped after a while when they're idle. So I wouldn't know, I wouldn't know. Thousands probably. In general terms, we are hosting more than 10000 databases, but to be honest that doesn't count for a lot of inactive databases. 
RVB: 03:05 Sure. Well that's still a big number. I'm very impressed. Very very well done. That's great. So where did it come from Alberto? How did you get into graphs, and how did you get into GrapheneDB? Tell us that story maybe. 
AP: 03:21 I've been telling everyone the wrong story. The wrong story, let me explain why. I've been telling everyone that in 2010 we were working on a clients project and we thought of using Neo4j. And we didn't end up using Neo4j, but for us it was when we discovered that there wasn't any hosting service out there for Neo4j or any other graph database. So we wanted to use it but we were relying heavily on Heroku and other cloud hosting services, and there was no option there. And for other relational and SQL databases there were options out there for Redis and for MongoDB and so on. So this is where the idea came from. But I just-- and this is true, this is still true, this is how the idea came together, but I remember I think a few weeks back I remembered why we were-- my question was why were we looking at Neo4j in the first place? How did we get to know Neo4j? And now I remember. So we attended Rails conference in Baltimore in the US in 2010 and there was a presentation by a guy called Matthew Deiters, and he made a presentation about putting useful recommendation in your APPs. So he actually spoke about the patterns and he introduced Neo4j for Rails using Neo4jRB by Andreas Ronge and this is how actually I met Neo4j and graph databases in the first place. 
RVB: 05:15 No way, okay. 
AP: 05:16 But it was hidden in some dark corner in my head [chuckles]. 
RVB: 05:22 [chuckles] Very cool. So how did that evolve into, I want to build a product around this, or I want to build a service around this? How long did it take you for that to materialise? 
AP: 05:36 So for two years between 2010-2012, it was a mix of we went up and down like, "Hey, there's no service for it, let's build it." Then, "Are we crazy? Why isn't there a service for this out there yet?" Of course we knew, especially back at that time, graph databases didn't have such big spike in popularity as they have right now, but still we didn't know if there were any special reasons for not being a service out there and so on. But eventually 2012 we started working on it. And early on we were just focused on the technical aspects, how we would do the hosting, how would everything work out. And then we focused on bringing out a bedder, and we didn't do even much validation around the idea. Yes we had a website where people could sign up for early access and so, but we didn't do any special experiments to test how easy it would be to monetise such a service or to run efficiently. But it turned out well and things were progressing and when we started inviting people, the feedback was positive. A lot of people found it very helpful and they would send feedback back saying, "This is a great service, we really love it. It's really useful to us," so that kept us working on it until-- 
RVB: 07:20 Very cool. 
AP: 07:21 It eventually became a business. 
RVB: 07:23 So what's the main attraction point do you think to Neo4j as a database category or as a database type, and then specifically to using it in a cloud environment. What's the main attraction do you think? 
AP: 07:37 I think it's the flexibility-- so for one, I'm seeing a lot of people use it for its flexibility in terms of modelling data and connecting data and then being able to query it altogether, because some of the other models are very restrictive in the way that you need to model your data. So if you're looking at relational databases, they could be called as well tabular databases because everything needs to be mapped into tables. 
RVB: 08:10 They're very anti-relational actually [chuckles]. 
AP: 08:12 Yes. So they're very very very strict and very rigid, and with other databases like let's say document databases are very flexible in terms of [?] of what you're going to store within a document, but again they're not very good in terms of how you connect data. So I think Neo4j and graph databases in general are a great middle ground and they excel at connecting-- actually where all others are actually failing, which is leveraging connections in your data. 
RVB: 08:49 It's actually really really funny that you mention that, because when you think about it, it's so logical that you combine that with the flexibility of the cloud model right? So you have your flexible database, flexible data model and then you have the flexible deployment model. It's kind of logical [chuckles]. 
AP: 09:04 Yes. So why cloud? I guess this depends on the kind of segment of use we're talking about. For some it's just convienient. If you want to-- like I myself when I'm trying to answer a question on stack overflow for example, I need to do some queries or insert some data, I don't set up a local Neo4j instance on my computer for that. Or I don't work on any other instances I have. I just go to GrapheneDB [?] books, it takes a second and then I have a database that I can use for testing. So for those kind of users it's just convienience and easy to use and the way that you can have multiple databases and swap them and-- 
RVB: 10:05 That makes a lot of sense. 
AP: 10:06 Go to one or the other. Now for others, it's more like the fact that some companies want to stay competitive in the way that they think that outsourcing your operations to the cloud is-- 
RVB: 10:28 Cheaper. 
AP: 10:29 Yeah. It's an area where they can save money and they can be more efficient. And anybody that asks, their scale is always going to be probably more cost efficient than any data centre you can run internally. And then there's another group, sometimes combined, which is the people that think, "We don't want to be dealing with hosting. I want to be using Neo4j, I don't want to be learning how to operate Neo4j." Let's say our best customers are those who value their time and they want to focus on delivering value to their clients, and looking how they can integrate Neo4j in their product, and they don't want to be running security updates to their servers or performing version upgrades of Neo4j and stuff like that. 
RVB: 11:23 Cool Alberto, I'm conscious of the time a little bit here, because I know my listeners and they like short and snappy podcasts, so I'm going to ask you one more question. Where's it going? What does the future hold, both for the industry and for GrapheneDB? Any perspectives? 
AP: 11:44 Let's start in the [?]. So for GrapheneDB, we are now Neo Technology enterprise partners since last year. We are doing a number of deployments with Neo4j enterprise for our customers-- 
RVB: 12:05 That's really cool, by the way. 
AP: 12:07 Which means we can cater the hobbyist who needs to have a free database to play around with, to very serious deployments on the cloud. This is where the service is heading, to make sure we can cater those customers and they have all the features that they need. This is for GrapheneDB, where it's heading right now. And in terms of the market I think, OpenCypher is really promising. I myself am a huge Cypher fan and everyone-- 
RVB: 12:44 Who isn't [chuckles]? 
AP: 12:46 Who isn't, yeah. When I've run training, everyone gets super excited about Cypher like from day one. Like after two hours they're-- 
RVB: 12:57 It's so powerful. 
AP: 12:58 Super excited about Cypher. So I think OpenCypher is great at catalysing this potential, and it excels really making it visible to the user. So if you are looking at Neo4j, you can see really quickly how you can extract value from it, rather than having to let's say spend two weeks learning how to query graphs. Besides the query language, I think the cloud is getting huge. I'm excited to see what kind of improvements can be added to Neo4j, specifically for a cloud in terms of scaling. There's a lot there. And then again the adoption. I'm increasingly talking to a number of people who just got to know Neo4j, and they are so excited, they can see their potential. We know what connected data they can exploit within their APP and within the database. And I expect a growing number of companies to do that, and to jump on the Neo4j boat. 
RVB: 14:21 Absolutely. Couldn't agree more. I think you've been a very very valuable to this entire ecosystem. I have tons of respect sir, for that. So thank you for doing all the hard work, and I think it's great to have you as part of the ecosystem. Hey Alberto, we're going to wrap up here. Thank you so much for coming on line, I hope it wasn't too late for you and I really appreciated talking to you. Thanks a lot. 
AP: 14:49 Thanks a lot Rick, and thanks to Neo Technology for putting such a great technology together, and it's a pleasure to work with you. 
RVB: 14:59 Same here. All right, talk to you soon man. Bye. 
AP: 15:02 Yes, talk to you, bye.
Subscribing to the podcast is easy: just add the rss feed or add us in iTunes! Hope you'll enjoy it!

All the best

Rik

Wednesday, 13 January 2016

The GraphBlogGraph: 3rd blogpost out of 3

Querying the GraphBlogGraph

After having created the GraphBlogGraph in a Google Spreadsheet in part 1, and having imported it into Neo4j in part 2, we can now start having some fun and analysing and querying that dataset. There are obviously a lot of things we could do here, but in this final blog post I am just going to explore some initial things that I am sure you could then elaborate and extend upon.

Let’s start with a simple query

// Which pages have the most links
match (b:Blog)--(p:Page)-[r:LINKS_TO]->(p2:Page)
return b.name, p.title, count(r)
order by count(r) desc
Run this in the Neo4j browser and we get:

or just return the graphical result with a slightly different query:

match (b:Blog)--(p:Page)-[r:LINKS_TO]->(p2:Page)
with b,p,r,p2, count(r) as count
order by count DESC
limit 50
return b,p,r,p2

And then you start to see that Max De Marzi is actually the “king of linking”: he links his pages to other web pages a lot (which is actually very good for search-engine-optimization) .

A quick visit to one of Max’ pages does actually confirm that: there’s a lot of cool, bizarre, but always interesting links on Max’ blogposts:
So let’s do another query. Let’s look at the different links that exist between blogposts of our blog-authors. Are they actually quoting/referring to one another or not? Let’s do

//links between blogposts
MATCH p=((n1:Blog)--(p1:Page)-[:LINKS_TO]-(p2:Page)--(b2:Blog))
RETURN p;

and then we actually find that there are some links - but not that many.


Same thing if we look at this a different way: let’s do some pathfinding and check out the paths between different blogs, for example my blog and Michael’s

match (b1:Blog {name:"Bruggen"}),(b3:Blog {name:"JEXP Blog"}),
p2 = allshortestpaths((b1)-[*]-(b3))
return p2 as paths

Then we actually see a bit more interesting connections: we don’t refer to one another directly very often, but we both refer to the same pages - and those pages become the links between our blogs. At depth 4 we see these kinds of patterns:

Interesting, right? I think so, at least!

Then let’s do some more playing around, looking at the most linked to pages:

//Which pages are being linked to most
match ()-[r:LINKS_TO]->(p:Page)
return p.url, count(r)
order by count(r) DESC
limit 10;

That quickly uncovers the true “spider in the web”, my friend, colleague and graphista-extraordinaire: Michael Hunger:

Last but not least, I wanted to revisit an old and interesting way of running PageRank on Neo4j using Cypher (not using the Graphaware NodeRank module, therefore). I blogged about some time ago, and it’s actually really interesting and easy to do. Here’s the query:

UNWIND range(1,50) AS round
MATCH (n:Page)
WHERE rand() < 0.1
MATCH (n:Page)-[:LINKS_TO*..10]->(m:Page)
SET m.rank = coalesce(m.rank,0) + 1

This does 50 iterations of PageRank, using a 0,1 damping factor and a maximum depth of 10. Running it is surprisingly quick:

If you do that a couple of times, and even do a few hundred iterations at once, you will quickly see the results emerge with the following simple query:
match (n:Page)
where n.rank is not null
return n.url, n.rank
order by n.rank desc
limit 10;
Confirming the “spider in the web” theory that I mentioned above. Michael rules the links!


All of these queries are of course on Github for you to play around with. Would love to hear your thoughts on these three blogposts, and hope that they were as fun for you to read as they were for me to write.

All the best.

Rik