Thursday 27 November 2014

My Graph Journey - part 2

In a previous blogpost, I told you the story of how I decided to get involved in our wonderful Neo4j community. I refused to make a difference between the *commercial* aspects of the Neo4j project, and the pure, free-as-in-speech-and-as-in-beer open source project and community. I believe that are one, have to be one. But. Once I had sort of made up my mind about getting stuck into it, there was a whole new challenge waiting for me. Neo4j - at least two+ years ago when my journey started, was not the easiest tool to use. There were many obstacles along the way - and while many of them have been resolved along the way, some still remain. Let me take you through THAT part of my journey - the part where I actually need to make Neo4j my friend.

I am not a programmer

Probably the single most obstacle to myself getting involved with Neo4j as a user, was that I don’t know how to program. I mean, at University I did *some* programming, but I think the world should be thankful for the fact that none of my code ever made it into production. Seriously. I suck at programming. Probably because I don’t really enjoy DOING it. I like talking about it, I love watching OTHER people do it (!), but I just don’t have the talent or the inclination to really do development. Sorry.

But let’s face it, Neo4j in 2012 was really very much a *developer tool*. It was not, by any means, something that you could hand of to a business user, let alone a database administrator, to really use in production. And I am neither of those. I am a sales person, and I love my job with a passion.
So how could I ever get stuck in with a development centric open source project like Neo4j? Well, I believe it’s really simple.

  • Ask great people for help. Don’t be afraid or ashamed to say that you don’t know something, and ask the people that do know for assistance. There are some great people in our community, and even more so at Neo Technology. As one of my colleagues put it: “NeoTech is so great, because there are no assholes here…”. Haha. There’s a lot of truth in that: my colleagues are great, and they help me whenever they can. I would love have been able to write this blog, write the book, speak at conferences, without their support. 
  • Failure is good. I think that’s probably the biggest thing that I learned along the way - and that I see lots of people NOT doing - is that they hold back, for fear of failure. They are standing on the sea shore, and are afraid to jump in - in spite of the fact that there are swimming teachers, rescue vests, lots of other swimmers and even the rock-star shark fighters available if something would go wrong. People just don’t try. And when they fail, they don’t ask for help (see above) and retry.
Trying something, failing, and then being able to humbly ask for help and assistance is the most powerful thing. You’re not failing because you are stupid. You’re bound to fail if you try something new… no guts, no glory! But so many people, so so many of them, never do try. It’s a shame. That’s basically how I got to try Neo4j, bump my head against brick walls time and time again, but after a while, feel like I was getting somewhere. That was a gradual process - but it felt and feels great. Now let me tell you about the two three powerful learning experiences that I had, from a more technical perspective.

Learning Neo4j

Of course, a Graph Database like Neo4j is new, or at least newish technology. So it is bound to be a bit different, and rough around the edges. If you can’t live with that, times are going to get rough. So what were the key new things that I had to get my mind around? Let’s go through the top three.

1. Learning how to Model

Modelling in a graph database is different, especially if you come from a relational background. Relational databases have many good things about them, but one of the inherent limitations to that model is that it’s actually quite “anti-relational”. What I mean is: every time you you introduce a new connection between two entities, you pay the price of having to join these two entities together at query time. Even worse in n-to-m connections, as that introduces the unnecessarily complex concept of a “join table”. So, so annoying. But the thing is, that we are used to thinking in that way - that’s how we were educated and trained, that’s how we practiced our profession for decades, so … we almost can’t help it but doing it that way.

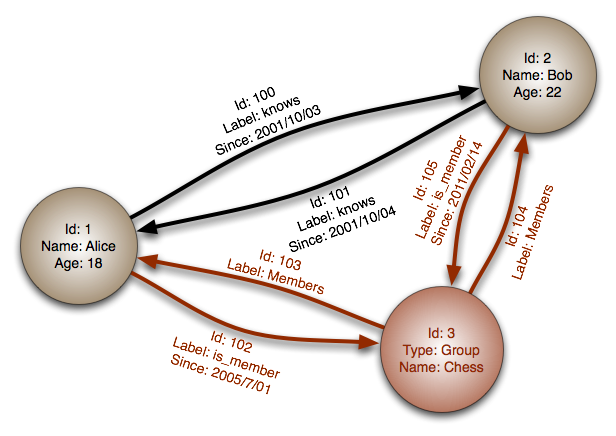
The fundamental difference in a graph model, I believe, is that introducing relationships/connections is cheap - and that we should leverage that. We can normalise further, we can introduce new concepts in the graph that we otherwise forget, we can build redundancy into our data model, and so on and so on. I won’t go into the details of Graph Database modelling here, but suffice to say that it’s different, and that I had to go through a learning curve that I would imagine would required for most people. It pays to model - and you should take your time to learn it, or ask for assistance to see if it makes good sense or not.

2. Learning Import

Once you have a model, you probably want to import some data into it. That, for me, was probably the biggest hurdle that I had to get over in order to learn Neo4j. I remember messing about with Gephi and Talend trying to generate a Neo4j database just to avoid having to use the import tools that were available 2.5 years ago, and asking myself why oh why is that so difficult. Surely there must be better ways to do that.
I meanwhile believe that Importing data into a Graph Database is *always* going to be a bit tricky (for the simple reason that you have to write data AND structure at the same time), but that there are specific tools around for specific import use cases. Now, luckily, these tools have moved on considerably, and I think if you look at my last “summary” of the state of Neo4j import tools, it has gotten a LOT better. My rule of thumb these days is that
  • for anything smaller than a couple of thousand nodes/relationships, I will use cypher statements (often generated with a spreadsheet, indeed) to import data. 
  • for anything up to a couple hundred thousand, and lower millions of nodes and relationships, I will usually resort to using LoadCSV, the native ETL capability of Cypher.
  • for anything that requires higher millions or billions of nodes and relationships to be imported, I will use the offline, batch-oriented tools.
It took me a while to understand that you actually need to use different tools for different import scenarios - but that’s just the way it is, at least today.

3. Learning Cypher

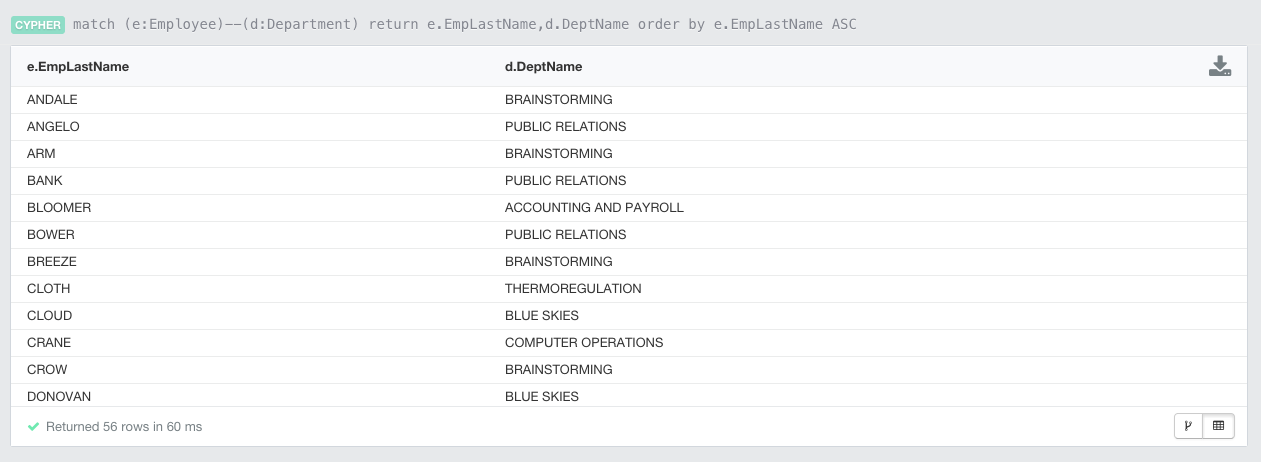
Last but not least, I really feel that learning Cypher, the declarative query language of Neo4j, is totally worth the while. It may seem counterintuitive at first: why do I need to learn yet-another-query-language to deal with this Neo4j thing - until you start using it. Things that are terribly hard in SQL, become trivially easy in Cypher. Queries of a 1000 lines or more in SQL, fit on half a page in Cypher. It’s just so, so powerful. And I have found that the learning curve - even for a non-developer like myself - is very, very doable. I would not call myself a Cypher expert, but I definitely feel more than confident enough today to handle quite sophisticated queries. And again: if I get stuck, I nowadays have books about Cypher, websites like Wes’, and friendly people everywhere to help me. Cypher - in my opinion - is the way to go, and Neo4j is only going to make it better with time.

That’s about it, in terms of my big lessons learnt on this wonderful Graph Journey. So let’s wrap it up.

Having fun while learning

I think the final thing here that I would like to add is that Learning Neo4j, even though a bit painful sometimes, has been a tremendously FUN experience, above all. Why otherwise would I come up with Graph Karaoke?


I believe that to be really, really important. Learning should be fun. So the more you can play with interesting datasets, the more you have the opportunity to share and discuss about that with your friends and colleagues, the more fun you will have and the more you will enjoy getting stuck in and learn some more. So set yourself up that way. Don’t be a lonely document out there - but connect with others and leverage the graph. I for one, am not regretting it for a second.

Hope this story was useful. Comments and questions always more than welcome.

Cheers

Rik

Monday 24 November 2014

My Graph Journey - part 1

Well, since everyone is doing it, and Michael asked me to write up my own graph journey...
 I thought I might as well do so. Maybe it will be useful for others. Challenge accepted.

How it started

I guess to really understand how I rolled into Graph Databases I have to take you back to the days of my university thesis. I graduated from the University of Antwerp in 1996, and at the time, I wrote a master's thesis about a "Document Management" solution. This was when the Internet was just starting to emerge as a serious tool, and for months I worked at EDS to figure out a way to use, size (storage was EXPENSIVE at the time!) and evaluate the tool. This turned out to be pretty formative: the tool (Impresario Ovation, later acquired by Wang) was a full-on client/server architecture, relying heavily on MS SQL Server 4.2 (the Sybase OEM). And I had to dig into the bowels of SQL server to figure out a way to size this thing. That, my friends, was my first and deepest exposure to SQL. And to be honest: I found it deeply, profoundly painful. I was deeply embedded in a complex data model full of left-right-inner-outer-whatever joins, and felt it was just... cumbersome. Very. Cumbersome.

After completing the thesis, I went on to graduate and start to work. First in academia (not my thing), then at a web agency, where I first got to know the world of Web Development at SilverStream Software. Don't want this to turn into a memoire, but that's when I got exposed to Java for the first time, that's where I learned about Objects, that's where I started following the writings of Rickard (at theserverside.com, at the time) who was developing JBoss, it's when I learned about Open Sources and... met Lars. Lars was working for Cambridge Technology Partners at the time, and they too just got acquired by Novell. CTP and SilverStream had many things in common, and we found eachother. We worked on a few projects, but then our ways parted. I left Novell to do a great startup called Imprivata, moved out of the world of app development - but always kept in touch with Lars.

How I bought into it

Years later, Lars and I reconnected. I had been working in the Identity and Access Management industry for a while, and ... got a bit sick and tired with it. I needed a change, and started to read about this brave new thing called Big Data and NoSQL. Friends of mine had been working on a next gen data architecture at a local startup called NGdata. Interesting stuff, but I somehow did not buy the "big is beautiful" argument. Surely not everyone would have these "big data" problems? Sure, they have big "data problems", but not necessarily because of volume?

And that's when Lars and I hooked up again. He called me to see if I was interested in joining Neo Technology, and after doing a bit of research - I was sold completely. Emil's vision of "Helping the world make sense of data" just really resonated with me. I knew what relational databases were like, and hated their "anti-relational" join patterns, and I had vaguely heard of networks, of graphs - and it just seemed to "click". I instinctively liked it. And accepted a job at Neo on a hunch - never regretted it to this day.

How I got sucked into it

When I started to work at Neo, the first thing I experienced was a company event. It was held at the lovely farm of Ängavallen, Sweden. I met some of the loveliest people then for the first time - all my colleagues at Neo now for more than 2.5 years. I love them dearly. But. There was a clear but.

Turns out that Neo Technology, the company that Emil, Peter and Johan had so lovingly built over the years, was a true and real hacker nirwana. It was very, very different from any company that I had ever worked for in the past, and I must say - it was quite a shock at first. This was the first time that I worked for an Open Source company, and looking back at it now it seems to me like it has all the positives, and some negative traits to it.

The thing is, of course, that this Open Source company was very, very motivated by the craft of software engineering and building out something technically sound, something they could be proud of, something that would stand the test of time, something that would change the world for the better. It was - and still is - very ethically "conscious", meaning that we want to do business in a way that is ethically sound. All very admirable, but if there is one thing that my 15+ years of selling hi-tech software had taught me, it was that that was not necessarily a recipe for commercial success. The market does not always award success or victory to the most technically sound or most ethical company - on the contrary. Selling high-tech software products is not always a walk in the park - and sometimes you need to make tough, ruthless calls - I know that, from experience.

So needless to say that this was a bit of a clash of cultures. Here I was, a technically interested but primarily business-minded sales professional, in a company that ... did not really care about sales. That's what it felt like, at least. I remember having numerous conversations with my colleagues and with other members of our wonderful Neo4j community, saying that there was this big divide between "commercial" and "community" interests. One could never be reconciled with the other, worse still, one - per definition almost - had to be opposed to the other.

I never got that. 

I never got that the "community interest" was different from the "commercial interest". To me they are, and have to be, one and the same.

Getting involved in the community

My logic was and still is very simple: if the "community" wants to thrive, there has to be a sustainable, continued and viable commercial revenue stream to it. If the commercial interests want to thrive, there has to be a large and self-sustaining community effort underpinning it. That commercial interest should not be the "used car sales" kind of commercial interest - but real, genuine commercial interests following from the ability to make customers successful and provide value to them in the process. My favourite sales book of the last decade is "Selling is dead" for a reason: selling means adding value to your customers' projects - not just chasing a signature on a dotted line. I wrote down my vision for commercially selling Neo4j in this prezi:

Community and Commercial interests have to go hand in hand, in my humble opinion. And that, my dear friends, is why I decided to get stuck in, to learn Neo4j myself, to write about it, to blog about it, to publish books about it, to talk about it at conferences, to write this blogpost.

My lifeblood, the thing that makes me tick, is making customers successful. I just love that. But I have learned over the years that in order to do that I will work with a mixture of tools that are partly purely commercially motivated, and partly motivated by the sense of open source community building that is so different from traditional commercial software vendors.

That, to me, was the most important part of my Graph Journey. A sales guy like myself, getting stuck in pure community building around the Neo4j project. A long term perspective on bringing this product and project to fruition. It has been a great experience so far, and I hope to continue it for a long time to come.

Thanks for the ride so far. All of you.

Cheers

Rik

PS: I will write about my actual learning experience wrt Neo4j later, in part 2. But I thought that the above was actually more important.

Saturday 15 November 2014

The IDMS EmpDemo - reloaded

A couple of weeks ago, I told the story of the interesting conversation that I had had with Luc Hermans about the similarities between IDMS and Neo4j. Luc gave me access to the EmpDemo dataset that ships with IDMS, and I sort of challenged myself saying that I would love to revisit his 2012 effort to import the data into Neo4j and do some queries on it. Not to see if you could migrate data from IDMS to Neo4j (that would be WAY more complicated, with all the software dependencies, of course), but just to explore the model similarities.

Now, several weeks later, I have something to show you. It's not always very pretty, but here goes :) ...

The IDMS schema file & sequential data

The IDMS input data was essentially structured in two files.
  1. The schema file. This file was pretty long and complicated, and describes the structure of the actual data records. Here's an excerpt for the "Coverage" data records:
     RECORD NAME IS COVERAGE  
          SHARE STRUCTURE OF RECORD COVERAGE VERSION 100  
          RECORD ID IS 400  
          LOCATION MODE IS VIA EMP-COVERAGE SET  
          WITHIN AREA INS-DEMO-REGION OFFSET 5 PAGES FOR 45 PAGES  
     *+    RECORD NAME SYNONYM IS COVERGE FOR LANGUAGE ASSEMBLER  
     *+    RECORD NAME SYNONYM IS COVRGE FOR LANGUAGE FORTRAN  
     *+    OWNER OF SET COVERAGE-CLAIMS  
     *+      NEXT DBKEY POSITION IS 4  
     *+      PRIOR DBKEY POSITION IS 5  
     *+    MEMBER OF SET EMP-COVERAGE  
     *+      NEXT DBKEY POSITION IS 1  
     *+      PRIOR DBKEY POSITION IS 2  
     *+      OWNER DBKEY POSITION IS 3  
          .  
     *+  02 SELECTION-DATE-0400  
     *+    USAGE IS DISPLAY  
     *+    ELEMENT LENGTH IS 8  
     *+    POSITION IS 1  
     *+    ELEMENT NAME SYNONYM FOR LANGUAGE ASSEMBLER IS COVSELDT  
     *+    ELEMENT NAME SYNONYM FOR LANGUAGE FORTRAN IS CVSLDT  
     *+    .  
    
    As you can see it is all about the "positions" of the data in the file: where does the record start, where do the fields in the record start and end - in the sequential file.
  2. The sequential file itself was a lot shorter in this case (it is just a small dataset). The coverage records mentioned above look something like this.
     C 00303011978110100000000F003  
      C 00403011975030100000000D004  
      C 00200031977012100000000M002  
      C 00400071978043000000000F004  
      C 00100111980092900000000M001  
      C 00200131981010200000000D002  
      C 00100161978010600000000M001  
    
    As you can see, all it is is a sequence of ASCII numbers that then need to be split up into the different fields, as defined in the schema above. Interesting. 
Unfortunately I can't share the actual files in public - but the above should give you a good idea what I started from.

Struggling with Sequential files - not my forte

Once I grasped these file structures a little bit, I continued to see how I could work with them to create an "importable" format for my Neo4j server. Turned out that was not that easy. I ended up using a two part process:


  1. I used a spreadsheet to convert the individual records into structured fields that I could work with. Here's the link to the google doc, if you're interested. Google Sheets has a function called "mid", that allows you to pick contents from a cell's sequential positions:

    which was exactly what I needed to do. Once I ficured that out, it was pretty easy to create the nodes in my Neo4j server. But how to extract the relationships???
  2. Turns out that I really did not manage to do that. I had to turn to Luc for help, and he basically managed to create a CSV file that used record IDs as the key to establish the relationships. Not pretty - and I still have no clue how he did that (let's just attribute it to the secret art of mainframe wizardry :)), but it did work...
Once I had this all I had to do was to use the structured information in my spreadsheet to generate cypher statements that would allow me to create the graph in Neo4j. That was easy. You can find the statements over here.

Updating the IDMS model to Neo4j

As I already mentioned in the previous blogpost, the similarities between IDMS and Neo4j data models are multiple, but there are also some differences. One of the most striking ones - for me at least - was how IDMS deals with many-to-many cardinalities in the data model. Including these types of relationships in IDMS requires the creation of a separate kind of "record", called a "Junction record". This is a the best explanation that I found over here:
For each many-to-many relationship between two entities, we will almost always identify additional attributes that are not associated with either of the two entities alone, but are associated with the intersection between the two entity types. This intersection is represented by another record type, called junction record type, which has one-to-many relationships with the two entity types. The junction record resolves the many-to-many relationship and implements this many-to-many relationship indirectly. 
Thinking about this some more: junction records are very similar to the relational database concept of a "join table". And as we know, we don't need stuff like that in Neo4j, as you can natively create these kinds of n to m relationships in Neo4j without having to think twice.

So that means that we need to make some updates to the data model, as Luc had already done in his effort. You can clearly see what needs to be done in the figure below:

In the IDMS data model we have three junction records:
  • the Emposition: relating the Employees to their jobs
  • the Expertise: relating the Employees to their skills
  • the Structure: creating a reporting line / managerial relationship between two employees.
So we need to write a Cypher statement that would update the graph accordingly. Here's an example of how I did that for the relationship between Employee and Job:

 //create direct link between employee and job (removing need for "Emposition" juncture record)  
 match (e:Employee)-[r1]-(emp:Emposition)-[r2]-(j:Job)  
 create (e)-[r:JOB_EMPLOYEE]->(j)  
 set r.EmpID=emp.EmpID  
 set r.StartDate=emp.StartDate  
 set r.BonusPercent=emp.BonusPercent  
 set r.SalaryAmount=emp.SalaryAmount  
 set r.OvertimeRate=emp.OvertimeRate  
 set r.EmpositionCode=emp.EmpositionCode  
 set r.CommissionPercent=emp.CommissionPercent  
 set r.FinishDate=emp.FinishDate  
 set r.SalaryGrade=emp.SalaryGrade;  
 //delete the redundant structure  
 //delete r1,r2,emp  

Note that the properties of the junction record (eg. startdate, salary, and others) are now moved from the junction record to a relationship property. Property graphs make relationships equal citizens, don't they! The full update statements that I created are over here. I have put the graph.db folder over here if you want to take if for a spin yourself.

So now, let's do some querying of this dataset with Cypher!

Querying the Reloaded EmpDemo with Cypher

One of the key differences between IDMS and Neo4j seems to be to me that we now have this wonderful query language at our fingertips to explore the network data. IDMS does have some query facilities (using a SQL overlay on top of native IDMS, as I understand it), but it seems to me like the Neo4j approach is a lot more flexible.

Here are some example queries:

 //what's in the dataset  
 match (n)  
 return labels(n), count(n)  
 order by count(n) DESC;  

Gives you the following result:

Or lets do some deeper queries:

 //Show employee and departments  
 match (e:Employee)--(d:Department)   
 return e.EmpLastName,d.DeptName   
 order by e.EmpLastName ASC  

Gives you:
Of course we can also look at some more graphical representations of our newly reloaded EmpDemo.  To illustrate this, let's look for some shortestpaths between Departments and Skills (bypassing the junction records that we mentioned above):

 //Paths between departments and skills  
 match p=Allshortestpaths((d:Department)-[*]-(s:Skill))   
 return p  
 limit 5;  

This gives you the following result:
Or similarly, let's look for the paths between departments and the different types of claims. This is a bit more interesting, as have different kinds of claims (Dental, Hospital, and Non-Hospital) which currently all have different labels in our data model. We can however, identify them as they all have the same "COVERAGE_CLAIMS" relationship type between the coverage and the different kinds of claims. So that's how the following query was split into two parts:

 //paths between departments and claims  
 match (c)-[ccl:COVERAGE_CLAIMS]-(claim)  
 with c, claim  
 match p=Allshortestpaths((d:Department)-[*]-(c:Coverage))  
 return p,claim  
 limit 1;  

First we look for the Coverage "c" and the Claims "claim" and then we use the AllShortestPaths function to get the links between the departments and the coverage. Running this gives you this (limited to 1 example):

Finally, let's do one more query looking at a broad section of the graph that explores the Employees, Skills and Jobs in one particular department ("EXECUTIVE ADMINISTRATION"). The query is quite simple:

 //Employees, Skills and Jobs in the "Executive Administration" department  
 match p=((d:Department {DeptName:"EXECUTIVE ADMINISTRATION"})--(e:Employee)--(s:Skill)),  
 (e)--(j:Job)  
 return p,j;  

and the result gives you a good view of what goes on in this department:

Obviously you can come up with lots of other queries - just play around with it if you feel like it :)

Wrapping up

This was a very interesting exercise for me. I always knew about the conceptual similarities between Codasyl databases and Neo4j, but I never got to feel it as closely as with this exercise. It feels as if Neo4j - with all its imperfections and limitations that make it probably so much less mature than IDMS today - still does offer some interesting features in terms of flexibility and query capabilities. 

It's as if our industry is going full circle and revisiting the model of the original databases (like IDMS), but enhancing it with some of the expressive query capabilities brought to us by relational databases in the form of SQL. All in all, it does sort of reinforce the image in my mind at least that this really is super interesting and powerful stuff. The network/graph model for data is just fantastic, and if we can make that easily accessible and flexibly usable with tools like Neo4j, the industry can only win. 

Hope this was as useful and interesting for you as it was for me :) ... as always: comments more than welcome.

Cheers

Rik

Friday 7 November 2014

Wasting time as a boothbabe @ Oredev

This blogpost essentially references a GraphGist that I created. Look at it in a full window over here, or below: I hope that was interesting - let me know if you have any feedback.

Cheers

Rik