Start Simple - in Antwerp
You will find all of these queries on Github, of course. But let's take you through some of my experiments, one by one.We start out by trying to find my hometown, Antwerp, Belgium, in the GTD. In order to do that, we just want to make sure that we have all the indexes in place on our database:

That looks ok. We have indexes on :city(name) in place, so we can do something like this:
match (c:City {name:"Antwerp"})-[r]-()
return c,r;
Looks pretty simple enough, but the result was a bit disturbing. Look at the graph below:

This caused me to look a bit into some of the data quality aspects of the GTD, and I did uncover a bit of an issue. If I run this query:
match (c1:City)--(ps1:ProvState)-->(c:Country),
(c2:City)-->(ps2:ProvState)-->(c)
where c1.name = c2.name
and ps1.name <> ps2.name
return distinct c1.name, c2.name ps1.name, ps2.name, c.name;
Then I unfortunately get this HUGE resultset with 27274 rows of essentially badly entered data.

So let's proceed to find some more terrorist events in my home country:
match (e:Event)-->(ci:City)-->(ps:ProvState)-->(c:Country {name:"Belgium"})
return c.name, e.id;

Good! Only 21 terrorist events in 44 years of history - that's ok. Happy to live in a safe place like that, especially if I compare it to some of the other countries: let's group them and count the number of events per country:
match p=(e:Event)-->(ci:City)-->(ps:ProvState)-->(co:Country)
return distinct co.name as Country, count(e) as NRofEvents
order by NRofEvents DESC
Clearly Iraq and Pakistan are not the safest places, but I was actually surprised to see the UK, the USA and the Philippines in the "top 10". Interesting.

Then of course you can also look at some interesting stats.
Terrible Terrorism stats - the graph does not lie
Let's say we would like to know more about specific dates and find out which dates had the MOST terrorist events, or which had the deadliest events. Querying for that is pretty easy, if we understand that the event-ID that is part of the event-nodes is structured as YYYYMMDDxxxx where xxxx is a sequentially incremented event id... Let's look at a query tp find the deadliest day in this GTD:match (e:Event)
return left(str(e.id),8), sum(e.nkill), sum(e.nwound), count(e)
order by sum(e.nkill) desc
limit 10
The result is

Or if I just want to look at the sheer number of events, then I just change the ordering:

So it's pretty darn clear that June 14th and June 15th of 2014 were pretty darn special. Let's take a closer look.
match (e:Event)
where left(str(e.id),8)="20140615" and e.nkill is not null
return e
order by e.nkill desc
limit 1
Exploring this a bit further in the Browser gives me:

Now I don't want to bore you with too many details, but... this one is quite amazing: the Camp Speicher massacre, committed by ISIS in Tikrit, Iraq. The story is unbelievable and sad, as told by one of its survivers here and here. Warning: shocking stuff.
After that depressing find, I actually started to dig around with some specific attacks in mind. So let's look at these.
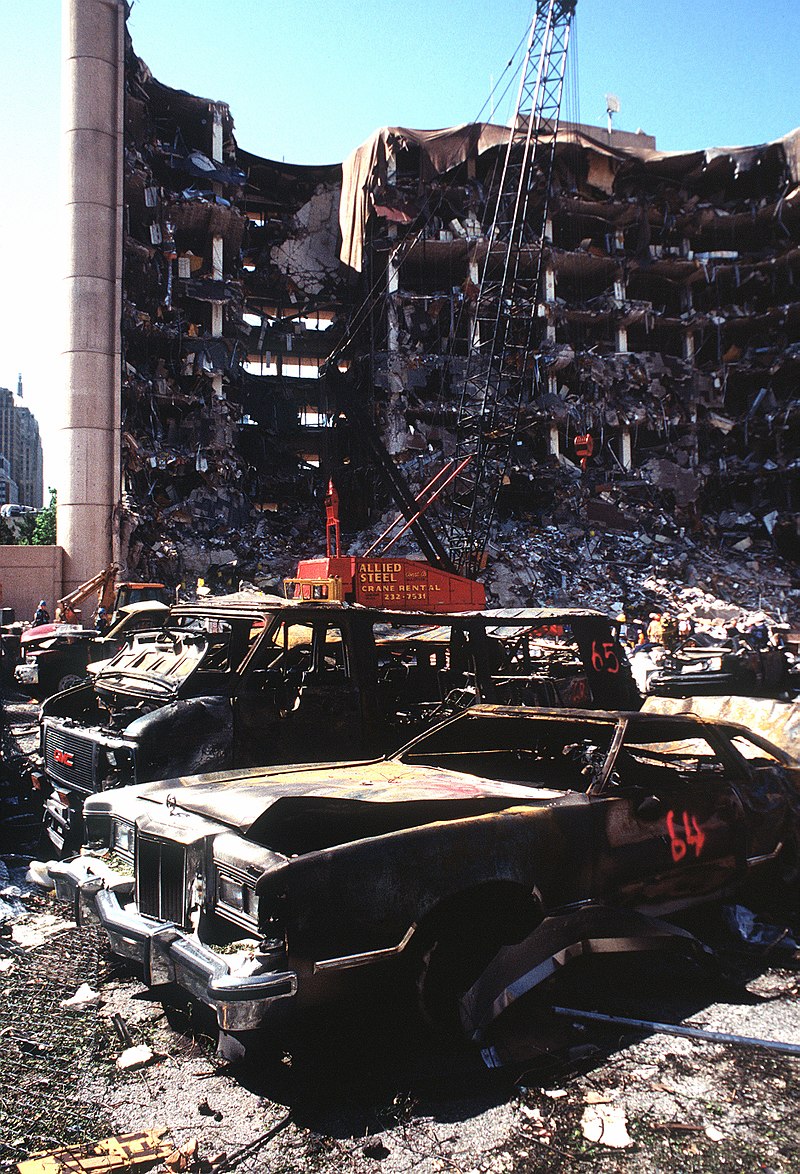 So the first one I decided to take a look at - not sure why, but anyway - was the Oklahoma City Bombing. I don't know that much about that event, but I do vividly remember the pictures on TV and the unbelievable story behind it - as if it was taken from a road movie. So let's look that one up.
First we try to find the city:
match (c:City {name:"Oklahoma City"}) return c;
By then using the Browser we can very quickly identify the event (which has an id of 199504190004 ) and look at some of the details:
match (e:Event {id: 199504190004}) return e;
And then we can start to zoom into the surrounding graph:

Interesting, and intuitive.
 So then, of course, we can take a look at another event - one of the most hideous and cruel attacks ever: 9/11. To do this, we need to take another look at the data and find the event. Using the same mechanism as above, I will take a look at the specific events on that sad day:
match (e:Event)
where left(str(e.id),8)="20010911"
return e
So very quickly, we then find out that there were a number of different attaches on that day:
 So let's focus on the ones that happened in the USA by simply expanding our pattern:
match (e2:Event)
where left(str(e2.id),8)="20010911"
with e2 as Event
match p = allshortestpaths ((Event)-[*..3]-(c:Country {name:"United States"}))
return p
Immediately we see the 4 related attacks on the same day:
 Now last but not least, let's see if we can find interesting connections. Because of the data quality issues that we uncovered above, the connections highlighted here may not be perfect or that interesting, but the principle I think could be super interesting in a true, well-maintained POLE database.
match (e2:Event)
using scan e2:Event
where left(str(e2.id),8)="20010911"
with e2 as Event
match p = allshortestpaths ((Event)-[*..3]-(c:Country {name:"United States"}))
With Event
limit 1
match p2 = allshortestpaths((e1:Event {id: 199504190004})-[*]-(Event))
return p2
limit 10
As you can see below, you do get an interesting view and a number of "suggested" links between different events - look at the "similar" events in the middle for example.
 No doubt that in a true POLE database application, that would be a great source of inspiration for further exploration.
That's about it what I have to share on my journey with POLE databases, the Global Terrorism Database and Neo4j. I hope it was useful for you - I certainly found it a very interesting excercise.
As always - feedback and comments would be very welcome.
Cheers
Rik
After that depressing find, I actually started to dig around with some specific attacks in mind. So let's look at these.
Digging into some specific terrorist events
First we try to find the city:
match (c:City {name:"Oklahoma City"}) return c;
By then using the Browser we can very quickly identify the event (which has an id of 199504190004 ) and look at some of the details:
match (e:Event {id: 199504190004}) return e;
And then we can start to zoom into the surrounding graph:

Interesting, and intuitive.
match (e:Event)
where left(str(e.id),8)="20010911"
return e
So very quickly, we then find out that there were a number of different attaches on that day:

match (e2:Event)
where left(str(e2.id),8)="20010911"
with e2 as Event
match p = allshortestpaths ((Event)-[*..3]-(c:Country {name:"United States"}))
return p
Immediately we see the 4 related attacks on the same day:

match (e2:Event)
using scan e2:Event
where left(str(e2.id),8)="20010911"
with e2 as Event
match p = allshortestpaths ((Event)-[*..3]-(c:Country {name:"United States"}))
With Event
limit 1
match p2 = allshortestpaths((e1:Event {id: 199504190004})-[*]-(Event))
return p2
limit 10
As you can see below, you do get an interesting view and a number of "suggested" links between different events - look at the "similar" events in the middle for example.

That's about it what I have to share on my journey with POLE databases, the Global Terrorism Database and Neo4j. I hope it was useful for you - I certainly found it a very interesting excercise.
As always - feedback and comments would be very welcome.
Cheers
Rik


