Showing posts with label bloom. Show all posts

Monday, 20 December 2021

Cognitive biases in Neo4j

I am an economist/engineer. I studied "Commercial Engineering" in Belgium in the nineties, and was quite an avid learner of economic theories large and small at the time. I did however, always kind of find myself uneasy at economists insistence on the rationality the homo economicus, as I knew, and observed all around me, that people were far from rational. That's why, ever since I learned of its existence, I have been a big fan of the field of behavioral economics - which actually tries to formulate ecomic theories that are real, and often times, irrational. I fondly remember first reading Dan Ariely's Predictably Irrational, and learning about some of the crazy biases that he observed and DESCribed. And Nobel-prize-winning Daniel Kahneman has been a hero for decades. I think about the Framing Effect) and Prospect Theory almost on a daily basis.

It all started with a tweet

So you can imagine my excitement when I learned about this tweet:

Monday, 2 August 2021

Summer fun with Musicbrainz: the "real" Six Degrees of Kanye West (part 3/3)

So: now that we have had some fun setting up our local Musicbrainz database (part 1), and importing the data into our Neo4j database (part 2), we can now start having some fun. That means: checking if that actual 6 degrees of Kanye West, and the actual "Kanye Number", is findable and reproducible in our Neo4j database, in an efficient way. Let's take a look at that.

Note: part of this effort was actually motivated by the fact that I have noticed that the python code that powers the above website, actually caches the results (see the github repo for more info) rather than calculate the Kanye Number in real time like we will do here. I guess that speaks to the power of graph databases, right?

But let's take a look at some queries.

Find other artists that worked together with Kanye

Let's start with some simple

match (kanye:Artist {name: "Kanye West"})--(r:Recording)--(a2:Artist)
return kanye,r,a2
limit 100

That gives you a bit of a peek already: Kanye's co-recorders

Summer fun with Musicbrainz: the "real" Six Degrees of Kanye West (part 2/3)

In the first article of this series we talked about our mission to recreate the Six Degrees of Kanye West website in Neo4j - and how we are going to use the (Musicbrainz database)[www.musicbrainz.org] to do that. We have a running postgres database, and now we can start the import of part of the dataset into Neo4j to understand what the infamous Kanye Number of artists would be.

Loading data into Neo4j

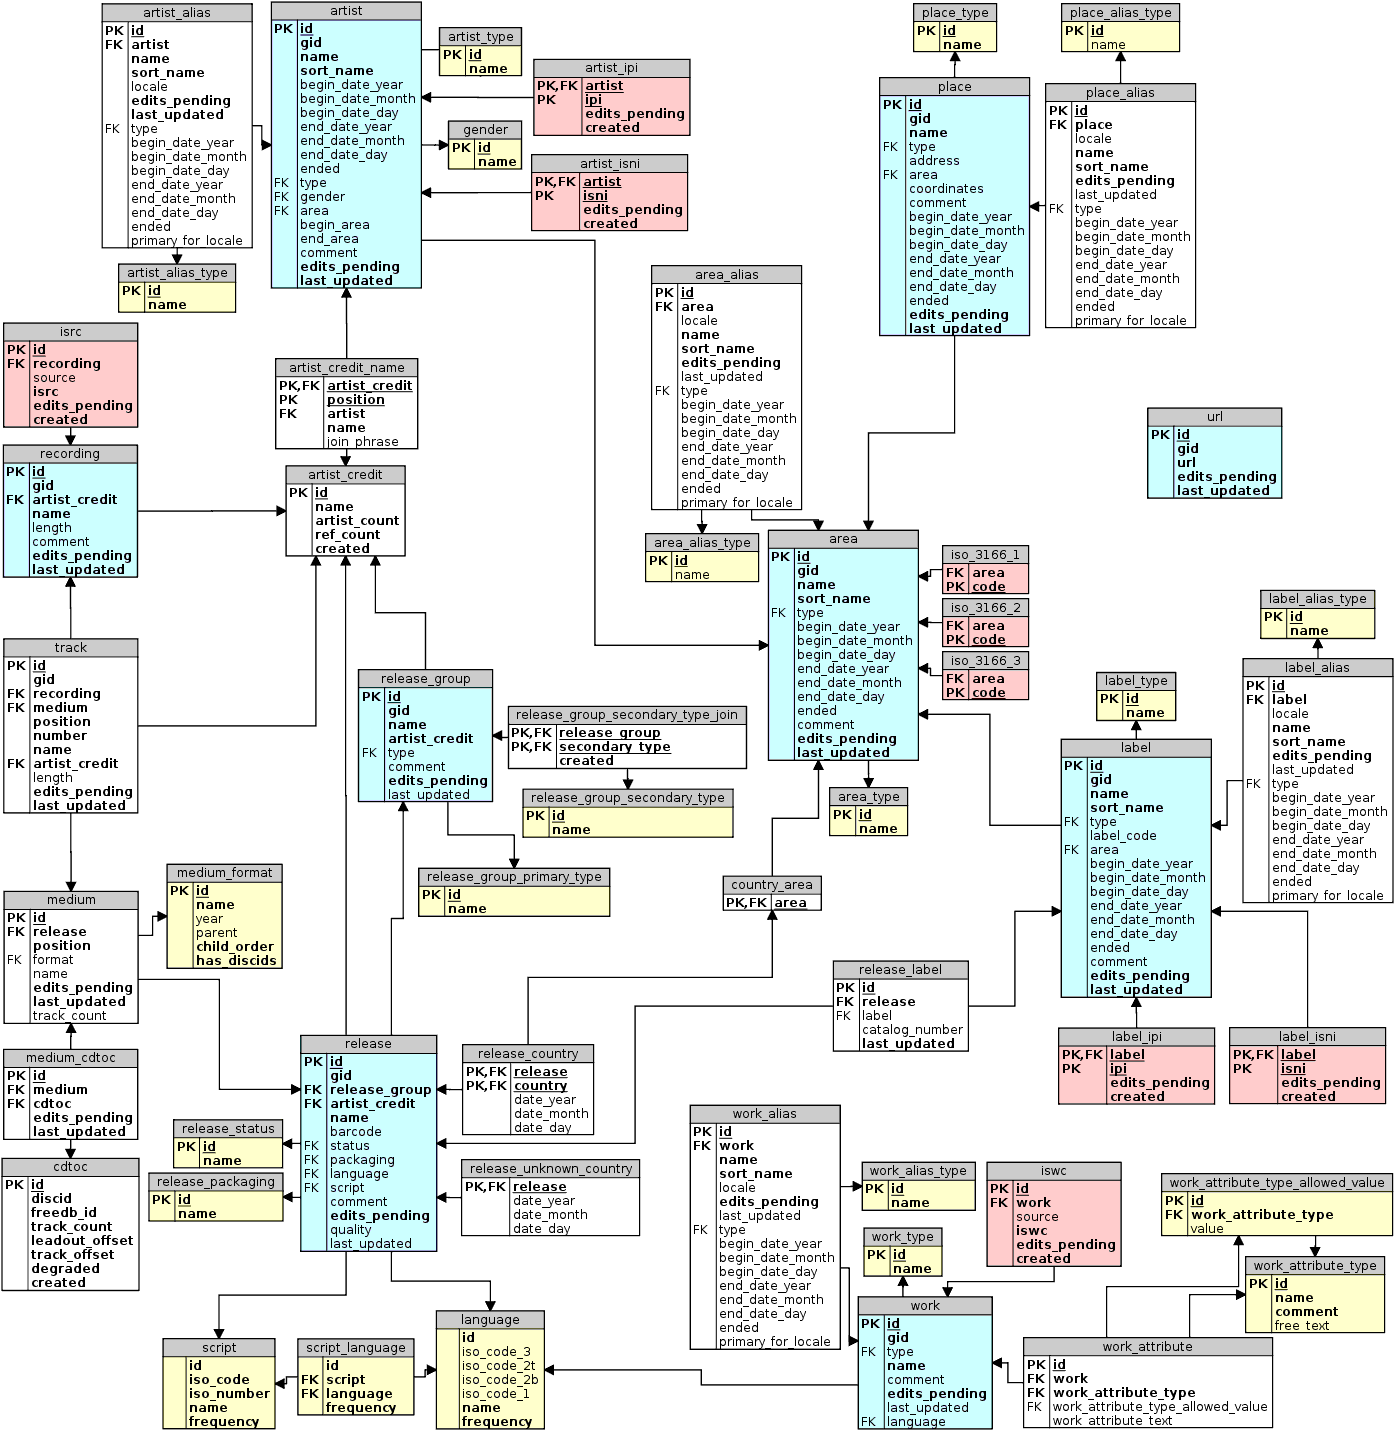
There's lots of different approaches to loadhing the data, but when I started looking at the model in a bit more detail:

  the model

Summer fun with Musicbrainz: the "real" Six Degrees of Kanye West (part 1/3)

Last year, I had a lot of fun working with a fantastic little tool that a colleague of mine created, to analyse and enhance Spotify playlists using Neo4j. While I was working on that blogpost, and I was experimenting with what little I know of Python code, I came across another example project that Spotify actually highlighted on their website: it's called Six Degrees of Kanye West and it's simply amazing.

The idea behind this site seems to be similar to the "Six Degrees of Kevin Bacon": if you have ever worked with Kevin directly, your Bacon Number is 1. If you have worked with someone that has worked with Kevin, then your Bacon Number is 2. Etc etc - and then this is applied to the idea of musicians working together on songs.

For example, if you go there and you look up some unknown artist (like then inimitable Belgian schlager singer, Helmut Lotti), like this:


Thursday, 10 June 2021

Network Analysis of Shakespeare's plays

What do you do when a new colleague starts to talk to you about how they would love to experiment with getting a dataset about Romeo & Juliet into a graph? Yes, that's right, you get your graph boots on, and you start looking out for a great dataset that you could play around with. And as usual, one things leads to another (it's all connected, remember!), and you end up with this incredible experiment that twists, turns and meanders into something fascinating. That's what happened here too.  

William Shakespeare

Finding a Data source

That was so easy. I very quickly located a Dataset on Kaggle that I thought would be really interesting. It's a comma-separated file, about 110k lines long and 10MB in size, that holds all the lines that Shakespeare wrote for his plays. It's just an amazing dataset - not too complicated, but terribly interesting.

The structure of the file has the following File headers:

DatalinePlayPlayerLinenumberActSceneLinePlayerPlayerLine
abcdefghijklmnopqr

Of course you can find the dataset on Kaggle yourself, but I actually quickly imported it into a google sheet version that you can access as well. This gsheet is shared and made public on the internet, and can then be downloaded as a csv at any time from this URL. This URL is what we will use for importing this data into Neo4j.

Monday, 29 March 2021

Part 3/3 - Wikipedia Clickstream analysis with Neo4j - some Graph Data Science & Graph Exploration

In the previous blogposts, I have tried to show
  • How easy it is to import the Wikipedia Clickstream data into Neo4j. You can find that post over here.
  • How you can start doing some interesting querying on that data, with some very simple but powerful Cypher querying. You can find that post over here.
In this final blogpost I want to try to add two more things to the mix. First, I want to see if I can do some useful "Graph Data Science" on this dataset. I will be using the Neo4j Graph Data Science Library for this, as well as the Neuler Graph App that plugs into the Neo4j Desktop. Next, I will be exposing some of the results of these Graph Data Science calculations in Neo4j's interactive graph exploration tool, Neo4j Bloom. So let's do that. 

Installing/Running the Graph Data Science Library

Thanks to Neo4j's plugin architecture, and the Neo4j Desktop tool around that, it is now super easy to install and run the Graph Data Science Libary - it installs in a few clicks and that you are off to the races:

Tuesday, 28 April 2020

Contact tracing guide for the Neo4j Browser

Based on the past two blogposts on (Covid-19) contact tracing (see here for the posts, here for the movies), I thought it would be a good idea to pick up an old skill - to create a Browser Guide for Neo4j for people to look at this dataset example more easily. I did this a long time ago for my beergraph as well, so why not do it for the contacttracinggraph :) ...

About the Neo4j Browser and Browser guides

Here's what this is: with Neo4j, the native graph database, we always ship a default user interface called the "Neo4j Browser". It's a interactive application that communicates with the database, and that essentially allows you to fire of Cypher queries and look at / manipulate the contents of your database. Read up about it over here. Once you have done that you will realise that the Browser is actually more than that: it's also a great way for people to learn more about Neo4j, and has a built in mechanism to share "guides" to various topics. If you experiment a bit with the following commands:

Title
Description
Command
Intro
A guided tour of Neo4j Browser
:play intro
Concepts
Graph database basics
:play concepts
Cypher
Neo4j’s graph query language introduction
:play cypher
The Movie Graph
A mini graph model of connections between actors and movies
:play movie graph
The Northwind Database
A classic use case of RDBMS to graph with import instructions and queries
:play northwind graph
you will get to see a number of topics that allow you to familiarise yourself with it really easily. Most of these guides are either built in or available for serving from a webserver. But: you can also develop these guides yourself. There's a really nice worked example over here, but the process really is dead simple:

Friday, 24 April 2020

(Covid-19) Contact tracing follow-up - demo movies

In my previous post I outlined the 4 different blogposts that I wrote about using the Neo4j Graph Database for Contact Tracing. Each of these posts is actually interesting in and of its own, and actually makes for a really nice demo of the capabilities in Neo4j. So I created those today - and put them on a Youtube playlist for you:


Tuesday, 21 April 2020

(Covid-19) Contact tracing - an amazing graph problem & rabbit hole

In the past couple of days, I have been working with several of my colleagues on a number of projects, all around the world, that are preparing our societies for a post-lockdown strategy that will allow us to keep the Covid-19 pandemic under control, and still regain some of our freedoms. This will be tricky, for sure, but as in so many problems, technology can probably assist.

That's why I started experimenting with how a graph database like Neo4j could help with this. Some of the tracing problems that we will face, are uniquely well suited for a graph database approach: it allows for us to see and understand the indirect contacts that healthy and sick people may have had with one another, and the effects that this could cause in our environments. It also allows for some unique predictive analytics: the structure of our contacts, the network/graph that it constructs, actually says a lot about the importance that parts of the network may play in the evolution of the pandemic. Graph Data Science can give us pointers as to where this should direct our policies.

This has ended up being quite an extensive piece of work. In order to keep it readable, I have cut it up into 4 blogposts, which I will put up all at the same time:
There's so much potential in this dataset, and in this problem domain in general. I feel like I have gone into the rabbit hole and have just resurfaced for some air. But who knows, maybe I will dive back in and do some more digging - after all, this is interesting stuff, and I love working on interesting topics.

Hope this is as interesting for you as it was for me.

All the best

Rik

Note that these demos will require the following environment: 
  • Neo4j Desktop 1.2.7, Neo4j Enteprise 3.5.17, apoc 3.5.0.9, gds 1.1.0, or
  • Neo4j Desktop 1.2.7, Neo4j Enterprise 4.0.3, apoc 4.0.0.6 (NOT later! a bug in apoc.coll.max/apoc.coll.min needs to be resolved)

(Covid-19) Contact Tracing Blogpost - part 4/4

Part 4/4: Some loose ends for the Contact Tracing graph

In this last part of this blogpost series, I wanted to quickly articulate some interesting points that I found useful during these experiments.

Using the geospatial data for some additional insights

You may remember that back in part 1, I imported some geospatial properties into our graph - assigning coordinates to all of the Places nodes that we have in the graph. Clearly this also opens up further possibilities for additional analysis, which I have not explored yet in the previous posts. Suffice to say that this data is super easy to work with in Neo4j. Just run a query like this:
match (pl:Place) return pl.id, pl.name, pl.type, pl.location limit 10;
And you can see that the pl.location property has a real geospatial data type that I can use:

Wednesday, 28 November 2018

Working with the ICIJ Medical Devices dataset in Neo4j

Just last weekend our friends at the ICIJ published another really interesting case of investigative journalism - tracking down and publishing the quite absurd and disturbing practices of the medical devices industry. The entire case with all of the developing stories can be found at https://medicaldevices.icij.org/ - take a look as it really is quite fascinating. Of course that meant that I wanted to see what that data looked like in Neo4j, and if I could have a play. I didn't have time for a full detailed exploration yet - but hopefully this will also give others the opportunity to chime in. So let's see.

The Medical Devices dataset as a graph

This turned out to be surprisingly easy. Just download the Zip file from the ICIJ website: https://medicaldevices.icij.org/download/icij-imddb-2018-11-25.zip, unzip this, and then we get 3 comma-separated-values files:
  • one for the Devices that are being reported on
  • one for the Events that are being reported (whenever something happens to a device (eg. a recall) then that is logged and reported)
  • one for the Manufacturers of the medical devices.
That's easy enough.

Wednesday, 31 October 2018

Data Lineage in Neo4j - an elaborate experiment

For the past couple of years, I have had a LOT of conversations with users and customers of Neo4j that have been looking at graph databases for solving Data Lineage problems. Now, at first, that seemed like a really fancy new word used only by hipster technovangelists to try to appear interesting, but once I drilled into it, I found that it’s actually something really interesting and a really cool application of graph databases. Read more on the background of it on wikipedia (as always), or just live with this really simple definition:
“Data lineage is defined as a data life cycle that includes the data's origins and where it moves over time. It describes what happens to data as it goes through diverse processes. It helps provide visibility into the analytics pipeline and simplifies tracing errors back to their sources.”
That’s easy enough. Fact is that it’s a really big problem for large organisations - specifically financial institutions as they have to comply with regulations like the Basel Committee on Banking Supervision's standard number 239 - which is all about assuring data governance and risk reporting accuracy.

Here’s a couple of really nice articles and videos that should really give you quite a bit of background.
 

Thursday, 23 August 2018

ESCO database in Neo4j: Skills, Competencies, Qualifications and Occupations form a beautiful graph!

Just a few weeks ago, I was discussing with Neo4j users that are active in the domain of "labour", or work. While talking to these users, they mentioned that there are standards out there that classify different types of work into different buckets (a taxonomy, if you will), and that there are two competing standards to do so out there. There's 
  • the ESCO standard: the European Skills, Competences, Qualifications and Occupations, and 
  • the ROME standard: the "Répertoire opérationnel des métiers et des emplois (ROME)"
The ESCO seems to be promoted by the European Commission, and the latter seems to be a Belgian/French initiative of some sorts. Surely they overlap, but I am not sure by how much. As luck would have it I started looking at the ESCO material first, but I am sure we could have written this post about ROME as well. It's the principles that matter.

And in principle, I figured that using these standards would be a really cool thing to do in Neo4j. Skills/Competences and  Occupations form really interesting graphy structures, and I could see how you could use a taxonomy like that to do some really interesting recommendations and other data workloads. So I wanted to give it a poke around.

Loading ESCO into Neo4j

The entire ESCO dataset can be downloaded from the European Commission's portal site: https://ec.europa.eu/esco/portal.  
It's really easy: you just select the data that you are interested in - the topic, format, and the languages - and put together a download package. 

In terms of format, you can choose between
  • an RDF format, which basically gives you a large (500MB) Turtle file. Turtle - the Terse RDF Triple Language, see https://www.w3.org/TR/turtle/ - is probably more comprehensive, as it contains everything. But it's also quite a bit more difficult to manipulate and get your head around. I was able to import the Turtle file really easily using Jesus' "neosemantics" plugins, and had it up and running in minutes. But I found it more difficult to use - most likely because I am not an RDF afficionado. Sorry.
  • CSV format. That's easy enough - we know how to import those. So all I needed to do was write a few Cypher scripts and import the data in a few minutes. I will put the scripts below, but you can also see them on github.
In any case, I opted to continue with the CSV files, and spent a little time importing the different files and connecting them together - in different languages. There's basically 5 files:
  1. the Skills
  2. the Skillsgroups, grouping the above together in groups
  3. the Occupations
  4. the ISCOgroups: this is a standard of the International Labour Organisation (ILO) that provides an International Standard Classification of Occupations. 
  5. and then a few files with relationships between Skills and Occupations, different ISCO groups, and different Skills/Skillsgroups.
I wrote the script pretty quickly - it's really not that hard - and then I ...
... ended up with a few Neo4j databases:
  1. one full of RDF triples - complicated!
  2. one with English Skills, Skillsgroups, Occupations and ISCOgroups. 
  3. one with Dutch Skills, Skillsgroups, Occupations and ISCOgroups.
In the Neo4j Desktop that looks a bit like this:
This is where the scripts are on Github.

Working with the ESCO database in Neo4j

Now that all that is imported, we can take a look at it. Let's start by looking at the model that we have imported. Pretty straightforward:
We can also just start looking at some data by just visually exploring it in the Neo4j Browser:
But it get's a lot interesting when we put Cypher to it, and start querying the data. For example, let me grab these two nodes here:
And look at the paths between them:
As always, the things that are located on the path, tend to be pretty interesting. Even more so when I think a bit more about the data, and start looking for the ESSENTIAL FOR relationship links. Let's see what comes back when I look for the links between a "software developer" and a "beer sommelier", when I ONLY traverse the relationships that define really important / ESSENTIAL relationships between Skills and Occupations:
Interesting. I am sure that a domain expert could do lots of other things here, especially if we could give that expert some non-technical tool like Neo4j Bloom.
All in all, this was a really easy and interesting experiment. I am sure there's a lot more to do here - but this was yet another example of a cool application of Neo4j in a surprising domain.

Hope this was useful.

Cheers

Rik
Friday, 1 June 2018

Using Neo4j Bloom for fraud detection, discovery and visualization

Over the past couple of weeks, I have been discussing and showing Neo4j's new Bloom graph discovery and visualization product to everyone that would have a moment to spare. It's soooo much fun to show a tool you love, and Bloom is definitely one of those. And I have also recorded some odf these demo-sessions - you can find part 1part 2 and part 3 of these recordings on this blog. All of these recordings use my (in)famous Belgian Beergraph dataset - and that's all good fun...

But of course, exploring a beergraph is not really a "business-y" use case. So I decided I would record a Bloom demo using a realistic dataset that centers around using Neo4j for Fraud Detection purposes. You will find all of the important concepts of the Beergraph demos here as well:
  • navigating the graph using graph patterns
  • using nifty selection / deselection techniques to only show what you need in the graph
  • creating better visualizations with colours and icons
  • editing the graph straight from the Bloom interface
  • creating custom search phrases for business uses and giving them near-natural language graph search capabilities.
Here's the recording:

Friday, 25 May 2018

Graphs are blooming - again!

A few weeks ago, I wrote a two part blog post about Neo4j Bloom and how I was playing around with my BeerGraph and figuring out some cool features of the new Neo4j product. You can find these posts over here
It included a first little demo video,

that seems to have been liked by a bunch of people :) ... thanks for that.

Wednesday, 9 May 2018

Part 2/2: Graphs are Bloom-ing

Earlier I wrote about how I connected the newly announced preview version of Neo4j Bloom to my good old faithful Belgian BeerGraph. See part 1 of this 2-part series for that story. I actually split up the story into two parts, because I feel like there's a super interesting and powerful part to Bloom that deserves a bit more attention: the mechanism of the custom Search Phrases.

As we mentioned in the previous post, Bloom structures your exploration and discovery into specific "views" on the graph data, called "Perspectives. You can select the perspective you find most appropriate from a dropdown - and customize/tweak/create perspectives yourself if you are not happy with the auto-generated starting point.

Monday, 7 May 2018

Part 1/2: Graphs are Bloom-ing

Last week something happened that really excited me. We, Neo4j, finally announced Bloom and demonstrated our own Graph Visualisation and Discovery tool, Neo4j Bloom. This is a technology that we have long been pondering, have experimented with in a number of ways, and have long looked to find and develop an offering that would be interesting and differentiated in what is already a very well looked-after marketplace. 

I am not exaggerating when I say that is truly exciting. Not only do many of our customers want to be able to visualise the results of their graph queries, but the graph data model is also unique in the way that it provides such an intuitive, easy to understand data model that lends itself so well to a GRAPH-ical representation. It truly fits into the Graph Platform vision that Neo4j has been advocating since 2017.