Showing posts with label interview. Show all posts

Friday, 16 July 2021

Graphistania 2.0, Episode 15: The Summer Session with Emil

Well this makes me very happy: just before many of us are taking some summer vacations, and ON THE DAY OF MY 2ND VACCINATION SHOT, I am able to publish another Graphistania podcast episode - interviewing my friend and boss (how awesome is it to be able to say that!) Emil Eifrem. We talk about the world, the graph database market, Neo4j the company, and of course, the products. It was a ton of fun, and I even got Emil to agree to publishing the video recording too :) ... Hope you enjoy it as much as I did. Here goes:

And of course the video:


Here's the transcript of our conversation:

RVB 00:00:01.709 So have I got your consent to record, please?

EE 00:00:07.850 Fine. [laughter] I want to put it on the record that you have my consent to record this and release the audio.

Monday, 11 January 2021

Graphistania 2.0 - the HAPPY NEW YEAR session!

A VERY HAPPY NEW YEAR, everyone! I hope 2021 will beat all of your professional and personal expectations, and OMG aren't we all hoping that we can see eachother in person a bit more this year. Let's make that happen, when it's safe to do so. For now, we will connect with each other remotely, among other things through this page and this... podcast. 

Here's a great episode for you. As always, we actually based our conversation on the awesome TWIN4J developer newsletter, which has some fantastic stories in there almost every week - definitely recommend that you subscribe to that one. Our summary of some of the posts is in this document, and here's the recording of our conversation: 

Here's the transcript of our conversation:

RVB: 00:00:20.848 Hello, everyone. My name is Rik, Rik Van Bruggen from Neo4j. And happy new year. Happy new year to everyone, and welcome to another episode our Graphistania podcast. So happy to be here again after this crazy year it was, 2020. And we are going to continue with the good thing that we started last year, which is I have my dear friend and colleague, Stefan, with me on this recording. Hi, Stefan.
SW: 00:00:56.121 Hello, Rik, and hello every single one of you out there in this completely new year, which is going to be, of course, completely different and not anything like the year before. Let's see how that turns out. We all know what's going to happen or what is already happening. But it can just be as good as we make it. So this is what I like doing, this thing with you, because it's really fun and inspiring, and I hope people feel the same.
RVB: 00:01:23.810 Yeah. Same here. Yeah. Thanks for being there. And, as usual, we have a lot to talk about, and we'll probably need to keep an eye on the clock here a little bit. But yeah, there's been so many great things, again, in the graph community that have been popping up. So many great examples that keep coming out in the This Week in Neo4j newsletter, but also everywhere on the community website. It's kind of amazing. I've got a couple of ideas to talk about. Why don't we run through those? Is that okay for you?
SW: 00:02:03.521 Yeah. That would be lovely. And, again, what better way to get your kind of lazy Christmas holiday brain to start than to dive straight in? So yeah.
RVB: 00:02:13.998 Exactly. Yeah.
SW: 00:02:15.499 Any one of those you're thinking of that stand out?
RVB: 00:02:18.754 Well, when I was going through the This Week in Neo4j newsletters, which is what I typically do in preparing for these podcasts, to just kind of see what's happening, right, what struck me is that there's a number of super, super interesting discussions and cases that are all about knowledge creation, how graphs can help you with not just knowledge management, so to speak, and structuring knowledge but really kind of creating new knowledge. People talk about machine learning and AI these days all the time. But it's amazing how things like this-- there was an article about the brain, which is one of those knowledge management tools that use graphs. Or some of the articles that Jesús wrote around multilingual taxonomies or the ArXiv connections. I mean, all of these use cases, they're all about, leveraging existing data, structuring it as a graph, and then using that to create new knowledge, which is fascinating in my book. What do you think about that?
SW: 00:03:39.777 Or maybe it's even like-- it comes, for me, from this fascination of, as you said, everybody running towards the latest technology. But what they do tend to forget is that there's a lot of [barriers?] just underneath their feet, right? But they can't see it. So all of that knowledge is there, however, they cannot see it because it's not connected, right? And I think that's the beauty of the graph and the way you can work with it to allow you to see the things that you already had answers to or the things that you didn't even know that you wanted to know, as I always say. And I think that is also coming back to a little bit on the way I think about strategy and behaviour prediction. I very often do this kind of the way of thinking from a anthropologist kind of view, right? Very like you can't isolate technology in one sense, but you need to study the full culture, meaning values, beliefs, artefacts, tools, behaviours, and everything at once, and I think that's when you get the fuller picture. And I think if there's anything that we have learned in the past year, it's that a lot of questions do not have a yes or no answer. It's not black or white. Very often, it's a nuanced answer. And I think that is the great part with graphs. It allow us to kind of reason about things in a more networking kind of way, so it's almost like it's enabled also. Not uncovering only the knowledge within your data, but it's helping you, actually, to create a more sustainable mental model in the way you think, right? So I think that is a lot of the cool things because if you can't see it, I mean, then you can't really think it in that sense, right?
RVB: 00:05:26.369 Very true. Yeah. One of the examples that was featured in the newsletters was all about these links between academic papers, right? I mean, if there's one place where there's a lot of knowledge being created and managed, it's, obviously, in academia, right? And now, people are starting to look at these things, like structuring academic papers and the links, the cross references, the citations that people make between different academic papers and creating big networks around that, right? And it made me think of you, Stefan. I think I've shared it with you in one of our private conversations as well. But there was this wonderful article that, I thought, was out there by a lady called Anne-Laure Le Cunff, I think her name is. She created this article around thinking in maps. How, actually, structuring knowledge, structuring ideas, structuring data as maps - and maps is just a type of graph, I would argue - is, actually, this age-old metaphor dating from the Lascaux caves back to the Egyptians, back to the Greek cultures. All this age-old technique of structuring data in maps, in graphs to make sense of them, to make sense of information, of knowledge. And some fascinating stuff there. And, obviously, me as an orienteering geek, I also like my maps.
SW: 00:07:16.465 Yeah. You heard map, and then you start running, right? [laughter]
RVB: 00:07:19.504 Yes, exactly. I'm like, "Map? Map, map, map? Where's the map?" But it was a fantastic article, I thought. I don't know if you had any thoughts on that.
SW: 00:07:31.537 No, I think it's so interesting. And also, since COVID around, there was a lot of labs, innovation labs - what I do work with there at Neo - that we also connected all of this kind of medical data, right? Because most of the time, this is also open data sources, but they are very siloed. And that's the problem, I think, with academia. They kind of drill this kind of deep hole with specialised knowledge, and they kind of forget that a lot of the value is also when you connect them. So I think it's super interesting, again, as you said, because if you can't see it, you can't do anything with it, right? And then you start to forget about it. So I think it's super cool to see it. Yeah.
RVB: 00:08:18.875 By the way, I wanted to mention that in almost all of the examples that I looked at in the newsletter and the past couple of months, I found that there's a lot of graph data science actually being applied, right?
SW: 00:08:35.361 Oh, yes.
RVB: 00:08:35.431 I mean, you know that it's kind of a new thing to the graph community, to really have an enterprise grade tool for applying data science concepts to graphs. But I think almost every single one of these knowledge creation examples that we just talked about has a data science component to it. It's amazing how that's been boosted in the past couple of months. You know what I mean?
SW: 00:09:05.233 Yeah. And I think, from a transformation kind of standpoint, what we see here, as you say, there is literally in every single one, right, because all of a sudden, this is now, because of the release of GDS library and what we do, there's a possibility for pretty much anyone to just fire away and start going with this. And one of the things which I think is so interesting, there's a couple of really good articles from Kristof there, like one where he kind of compare Neo4j with NetworkX and do, in his own words, a drag race of sorts, which I think is also interesting to see. A lot of these things, you could do in smaller scale before, but you couldn't do it in the same kind of system where you have your transactional thing. And this is a lot of what I see because if you can put all this power in one system, and that system allows you to work faster, that is the game changer. Because if you can, I think the other article, there is a good example of calculating centrality at scale where the example was something about 20 million or something, and it should take approximately five years to calculate. You can do it in theory, but let me know any business that's going to wait five years for the result of that. That's, literally, not happening. But when you can start to get these examples in real time, then you're allowed to try out things. And I think this is just the beginning of seeing this whole wave of new companies behaving instead of just like the team at Google or some of those big giants, right? Now it's democrat times, so it's for everyone, so.
RVB: 00:10:51.795 Yes. Literally, that's the right word, right? It's democratisation. You used to require a super computer to do this stuff, right? I mean, I don't know if you remember, but Cray supercomputers, they used to have-- they used to have a spin-off company called Yarc. And Yarc, all they did was they sold custom Cray computers that did - drum roll - graph processing, right? That's what they did. And now, you run that on your laptop. The democratisation of this stuff is just so impressive. And I thought it was super interesting to see that article about comparing it to NetworkX because I actually like NetworkX. I think it's a really, really cool tool.
SW: 00:11:44.419 Yeah, it's amazing.
RVB: 00:11:46.967 But if you just look at Kristof's test, you can kind of see, to do something really simple, it takes minutes in NetworkX, and it takes seconds on Neo4j. And then you're like, "Hmm. That's not a trivial thing." That has an impact on the rate of innovation, the rate of how easy it is for people to adopt it, yes or no. That's not a trivial thing. To be able to do things at that speed, it's just kind of meaningful. And I'm quite happy about that. So it's very impressive.
SW: 00:12:26.767 Yeah. But I 100% agree to that. And I think this idea, you can look upon this from the time perspective, this is how much I would save, and then like 1 second compared to 10 minutes, it's not that much. I can go and take a coffee. But I think from an innovation and in a cognitive kind of human capacity, what happens when you are allowed to just try and explore is that you're going to try 100 new things during the rest of those seconds in that 10 minutes time, right, which will allow you to more of, again, the word that we said before, things that you didn't know that you wanted to know that you already, in one sense, had the data, but you couldn't see, right? So I think, again, that's so amazing to see this happening. I've just downloaded and try it out, working with embeddings and stuff during the holidays, and it's mind-blowing. I really encourage every single one of you out there to just do it and go ahead.
RVB: 00:13:27.117 Yeah. And there were some other-- I mean, I think there's some other examples, not just in processing speed but also in how quickly can you get something done. Can you get to an end result? I mean, if I look at the work that Adam did with this new graph app called Charts, I'm like, "Wow. This is so cool." Because I mean, you used to have to develop this entire front-end app to kind of expose this to your colleagues, right, to show it to someone. And now, it's just like click, click, click, click, click, and [inaudible], you're up and rolling, and you can show it to people, not just the speed of processing, but also the speed of development and things like that. GRANDstack, the BI connector, some really cool articles that we saw in the past couple of months that showed that. Really, really quite impressive, I must say.
SW: 00:14:20.687 Yeah. I really second that. And I think this is where we see, again, on a level of transformation within companies, right? Because there's one part to validate your use case from a data and technology standpoint, and then, of course, you need to validate the business part. But one thing, and I worked with Adam in a lot of these labs that we do, right, and this was an idea that we have been talking about for ages, and I'm so happy to see this coming alive because the one times that we tried putting people that literally coming into the room saying, "I hate data because it never works," give them the graph, the power of the graph in a simple interface like this, and all of a sudden, these people stand up and screaming, "I love data. I love graphs." So this is like the graph epiphany moment times like - I don't know - 100 or something. So I'm super happy to see it. And I think, again, it's just amazing to see how much goes so fast, so super cool.
RVB: 00:15:20.954 All right. Well, I think we're going to wrap up it. Just maybe one more question. What was your favourite title of the articles that you read? I know I have one. I have one in mind. [laughter]
SW: 00:15:32.535 What could that be? Let me know.
RVB: 00:15:34.558 I think it's The Pulumi Platypus And The Very GRAND Stack. [laughter]
SW: 00:15:40.368 Yeah. It's hard to beat that one.
RVB: 00:15:42.801 It's really hard to beat that one. It's a super, super-- Pulumi Platypus And The Very GRAND Stack, yeah. A really cool article. [laughter]
SW: 00:15:50.523 It's an amazing one. The one I was thinking-- actually, I don't know why. Maybe this is, again, me being nerdy again. But when you said any good title, the only one I was thinking was this network analysis of the Marvel Universe.
RVB: 00:16:05.990 Oh, yeah. Of course. Yeah.
SW: 00:16:06.410 But I guess that has nothing to do with titles. It has [crosstalk] me and my childish behaviour that will never leave my body. [laughter] Yeah.
RVB: 00:16:15.794 We love you for it. We love you for it. So hey, Stefan, thank you taking the time to talk us through these different posts. We're, obviously, going to include them in the transcription of the podcast. It's been great talking to you again. And I'm looking forward to a great new series, right, where we're going to keep this up and keep on making these little podcast recordings together. It's been so much fun.
SW: 00:16:41.855 Yes. Super great there. Happy to speak to you again, and waiting for the next one already.
RVB: 00:16:48.182 Me too. Thank you, Stefan. Have a great day.
SW: 00:16:51.806 Great day. Bye.
RVB: 00:16:53.294 Bye.

Subscribing to the podcast is easy: just add the rss feed, find the show on Spotify, or add us in iTunes! Hope you'll enjoy it!


All the best

Rik
Tuesday, 24 November 2020

Graphistania 2.0 - Episode 11 - The Emil Update

Yey! I got to do it again. For the 4th time in the history of this weird thing called the Graphistania podcast, I have had the change to spend some quality time talking to Emil Eifrem, our fearless leader and CEO of Neo4j. As last time, we actually recorded the video, so you will find the zoom call, and the MP3 version of it, below in the blogpost - along with the habitual transcription.

Hope you will enjoy the chat as much as I did.


Here's the link to the youtube video of the call:

Thursday, 12 November 2020

Graphistania 2.0 - Episode 10 - This Month in Neo4j

Hi everyone

Hope you are all well, keeping safe, and finding some time to relax and enjoy life in this wonderful rollercoaster that is 2020. Think of it this way - we will never forget this ride, EVAH! 

As you can imagine, things have been evolving at warp speed in the wonderful world of graphs as well. So me and my partner in crime Stefan had another chat about all the things we have seen pop up, mostly through the awesome This Week in Neo4j (Twin4J) newsletter. Here's the chat we recorded:

Here's the transcript of our conversation:

RVB:00:00:01.448 Hello, everyone. My name is Rik, Rik Van Bruggen from Neo4j, and here I am again recording another episode of our Graphistania Neo4j podcast. Wonderful time of the day to start with this type of conversation because I have my dear friend, Stefan, on the other side of this call. Hi, Stefan. How are you?

Tuesday, 6 October 2020

Graphistania 2.0 - Episode 9 - The one about the (Graph Databases for) Dummies (book)

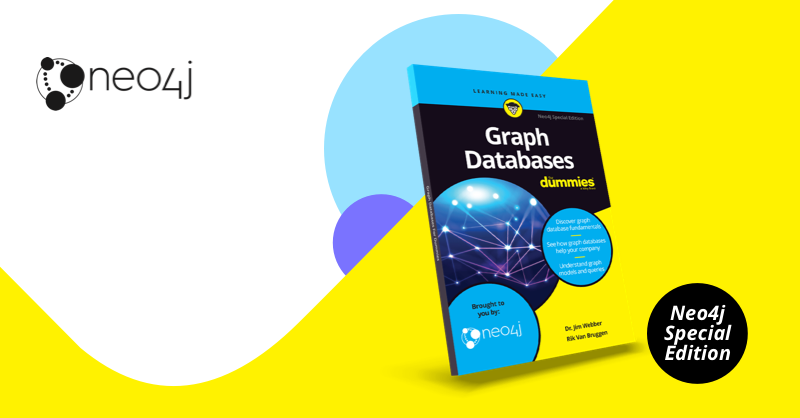
Here's a nice new episode of the Graphistania podcast for you: for the first time in 5 years, I was able to get the fantastically awesome Chief Scientist of Neo4j, Dr. Jim Webber, back to the podcast. Jim is a great colleague and friend, and one of the best tech public speakers in the business - especially when you want to talk Graphs and distributed systems. Over the past few months, I had the pleasure of working together with Jim on a more regular basis - as we actually wrote a book together: the Graph Databases for Dummies book. It was announced on the Neo4j blog, and seems to have been doing really well in the past few weeks. Some of you may remember that Jim co-wrote The O'Reilly book on Graph Databases, and I wrote Learning Neo4j by Packt (2nd edition together with Jérôme Baton) - and we have had a bit of friendly banter going back and forth about the quality of both artifacts :) ... it has been a ton of fun.

So here's the chat that we recorded about the new book - hope you enjoy it as much as we did.

Here's the transcript of our conversation:
RVB - 00:00:00.151 Hello, everyone. My name is Rik, Rik Van Bruggen, from Neo4j, and here I am again recording another episode of our Graphistania podcast. And this is a special one. This is a special episode, one that we've been talking about for some time, because I have a very special guest on this show, and that is my dear friend and colleague Jim Webber. Hey, Jim.

Monday, 7 September 2020

Graphistania 2.0 - Episode 8 - The one after the Covid-summer

No sure if we should be happy or sad - but hey - the Covid-19 summer of 2020 is almost behind us. Like most people, I found it quite a strange and unusual summer, with very few foreign adventures (although I did manage to squeeze in a cycling/camping trip to the French Alps in July), lots of cycling, some great family time... and of course lots of time with graphs :) ... 

So that means that we are also kicking the Graphistania podcast back into gear - here's the next episode for you:


Here's the transcript of our conversation:

RVB: 00:00:15.863 [music] Hey, Stefan, I do need to ask you for consent, I think, right?

SW: 00:00:19.847 Hi. Yeah, I consent. [laughter] This is always the weird moment.

RVB: 00:00:24.727 Exactly. I thought, "Start with that one again."

SW: 00:00:28.436 Exactly, just to create a little bit of tension in the air.

Tuesday, 14 January 2020

Graphistania 2.0 - Episode 3 - This Month in Neo4j

Happy new year everyone - although it actually seem like the holidays are already very far behind us! But great times were had, at least in my family, and so I feel super energised to make 2020 another great start to a decade of graphs :) ... Here's to that!

It also means that we are continuing to see all these awesome community stories pop up left right and center in the Neo4j "This week in Neo4j" developer newsletter. And so on our Graphistania podcast, we are going to continue talking about these on a monthly basis. So that's what we're doing - and I have again invited my friend and colleague Stefan Wendin to join me.

From the newsletter, we always select a few stories that we think will be more interesting and/or meaningful to discuss. This month, we found a number of them, and the interesting thing was that the graph-stories seemed to play at very different scales... The Personal, Corporate, and Society levels. Here are some of the ones we liked:

At the Personal scale
At the Corporate scale
At the Society scale, we saw some amazing posts:
So I think you agree that we had plenty of stuff to talk about. Let's get into that!

Wednesday, 3 July 2019

Finally: someone interviewed me on their podcast

This is worth a small celebration. Super conversation (in Dutch) with Jurjen Helmus, Walter van der Scheer and wingman Ron van Weverwijk on the Dataloog podcast about the use of graph databases and Neo4j. Listen to it over here over here - or find it on itunes/spotify.


Lots of fun to do - hope you enjoy it as much too!

Cheers

Rik

Tuesday, 26 March 2019

Podcast Interview with János Szendi-Varga, GraphAware

Finally - managed to get out another episode of our podcast. Early February, our friends of GraphAware published a great blogpost about their view of the "Graph Technology Landscape". The main author János Szendi-Varga, was kind enough to spend some time with me on the phone talking about our industry and where it's going. Hope you enjoy it as much as I did!


Here's the transcript of our conversation:
RVB: 00:00:03.184 Hello everyone. My name is Rik, Rik Van Bruggen from Neo4j, and here we are again recording another episode of the Graphistania, Neo4j graph database podcast. And today I have a special guest on the podcast all the way from the UAE in the Middle East and that's a very, very interesting person that did some amazing work recently with the graph database landscape. It's János Szendi-Varga. Hi János.

Tuesday, 26 February 2019

Podcast Interview with Amy Hodler, Neo4j

Yes! Another great interview for our podcast, this time with a great colleague of mine who has a big mind and many ideas around one of the most fascinating and under-used topics evah: Graph Algorithms and Artificial Intelligence. Amy Hodler has a lot to say on this topic, and is about to publish a fantastic new book on the topic together with Mark Needham. I think you will enjoy this one - even though it's a bit longer than usual. Here goes:


Here's the transcript of our conversation:
RVB:  00:00:00.938 Hello, everyone. My name is Rik, Rik Van Bruggen from Neo4j, and here we are again, recording another episode of our Graphistania Graph Database Podcast. And tonight I have a dear colleague of mine on the other side of this Google call, and that's Amy Hodler. Amy, how are you?

Tuesday, 5 February 2019

Podcast Interview with Jess Mason and Jason Cox, Untiltled Folder

Yeah,  I think I am going to repeat myself. Another podcast that was long overdue waiting to be published. I interviewed my next guests middle of December 2018, and it's hard to believe that I only just MADE the time to publish the episode. My bad - again. It's another great chat though - so you should still listen and look at some of the very cool links included below - you will not regret it. Jess and Jason are doing some amazing stuff with Neo4j over in Philly, and check it out. Here it goes:


Here's the transcript of our conversation:
RVB: 00:00:26.434 Hello, everyone. My name is Rik, Rik Van Bruggen from Neo4j, and here I am, again, recording another Neo4j Graph Database Graphistania Podcast. And tonight I am joined by two guys from Philadelphia in the USA that have been doing some amazing work with Neo4j. And on top of that, they have the funniest company name, I think at least. It's called Untitled Folder. That's Jess and Jason. Jess and Jason, welcome to the podcast.

JM: 00:01:04.071 Hi. Thanks for having us on the podcast.

JC: 00:01:04.525 Hello.

Friday, 21 December 2018

Podcast Interview with Emil Eifrem, Neo4j

We've been around the block a few times in this podcast. It has been a fantastic experience to develop this thing from a crazy idea at a booth at Qcon (thanks again, Michael!) into something that has really gained a life of its own. I for one still enjoy making them time after time - I hope they are a good listen/read as well.

As part of that journey,  I have course also interviewed our "Fearless Leader" and "Chief Instigator", aka Emil Eifrem, a few times. We talked in summer of 2015, and then again around this time of the year in 2016 -  and swore expensive oaths not to let another episode be too long after. And we failed miserably. So it felt right to do a longer, more elaborate episode now, which we actually published with video on Youtube too:


Of course the Podcast feed and Soundcloud have the same show episode too:

Here's the transcript of our conversation:
RVB:   00:00:54.475 Hello, everyone. My name is Rik, Rik Van Bruggen, from Neo4j and here I am recording another podcast episode. And I think the other person on the other side of this call is going to agree that it's been way too long.

Monday, 3 December 2018

Podcast interview with Will Lyon, Neo4j

Been a while since I have been able to publish more podcast episodes - sorry about that. Will try to keep up a regular pace - but no guarantees. However, I must say that the conversation that I had with my colleague Will Lyon made me think that I really should keep it up... the Neo4j ecosystem, and company is full of people with lots of interesting things to say - and talking to them is just a blast.

So this conversation was long overdue, because Will has done SO MUCH for the Neo4j Community in the past couple of years - it's pretty crazy. How do you start a conversation like that? Turns out it's really easy. So nice. Listen to it over here:

Here's the transcript of our conversation:
RVB: 00:00:00.615 Hello, everyone. My name is Rik Van Bruggen from Neo4j, and tonight I have a very long overdue guess on this podcast episode. Someone that I've been dying to talk to, actually, for quite sometime because he's done such an amazing job in the Neo4j community over the past couple of years. And that's my colleague, Will Lyon. Hi, Will.

Friday, 12 October 2018

Podcast Interview with Michael Simons, Neo4j

For this week's episode of our Graphistania podcast, I had the great pleasure of spending some time on the phone with Michael Simons - one of the talented Neo4j engineers that build our products. Michael only recently joined our team, and we actually got talking on our internal channels about something we both love dearly... Bikes. I did a ride in Belgium recently that Michael found interesting and then he rode it himself as well - and hey, we got talking. One thing led to another, and before you know it we are recording the conversation... Here it is:


Here's the transcript of our conversation:
RVB: 00:00:01.418 Hello, everyone. My name is Rik Van Bruggen from Neo4j, and here I am again recording another episode for our Graphistania podcast. And today, I have one of my dear colleagues on the other side of this Google Hangout again, and that's Michael Simons from Neo4j engineering. Hi, Michael.

MS: 00:00:19.623 Hi, Rik.


Wednesday, 3 October 2018

Podcast Interview with Michael McKenzie

Why spend my evenings/weekends/empty hours creating a podcast? Well that's very simple: I love talking to like-minded people in the graph community. There's something about this community that attracts people that are equally fond of "connections" and building relationships that is just too awesome to explain. I love it. So when Karin told me about this guy in Washington that was doing awesome things with Neo4j and was helping out with community activities (he wrote about it over here), I was all too keen to have a chat with him. Meet Michael McKenzie, from Washington DC - here's our chat:

Note: I recorded this with Michael before our fantastic GraphConnect conference in New York a few weeks ago - but did not have the time to publish it earlier... apologies...


Here's the transcript of our conversation:
RVB:00:00:00.000 Hello, everyone. My name is Rik. Rik Van Bruggen from Neo4j and here I am again recording another Graphistania Neo4j podcast. And today, I have a wonderful community member on the other side of this Google hangout and that's Michael McKenzie from Washington, D.C. in the US. Hi, Michael.

Tuesday, 11 September 2018

Podcast Interview with Karin Wolok, Neo4j

Next week is GraphConnect New York City 2018, and that's of course a big highlight for all of us at Neo4j. You should really be there if you can :) ...

One of the reasons why GraphConnect is such a great event, is because it allows us to connect all the nodes in the graph and have a great couple of days of real-world conversations about this fascinating topic called graphs. Again, we are going to have a great line-up, not in the least because of all the great community content that we will be presenting and working on during the event.

On top of that, we have had a LOT going on in the Neo4j Community recently - with the launch of a new community site and more. That's a good enough reason for me to invite Karin Wolok, our Community Manager at Neo4j for a good chat. Here it is:


Here's the transcript of our conversation:
RVB: 00:00:00.819 Hello, everyone. My name is Rik, Rik Van Bruggen from Neo4j. And here I am again recording another episode of our Graphistania Neo4j podcast. And today's a little bit of a special episode I think because it relates to something very dear to my heart and many people at Neo4j's heart, which is our Neo4j community. And for that, I've invited Karin Wolok on the podcast. Karin is our community manager. Actually, you have a very different and more expensive-sounding title, right, Karin? But maybe you can introduce yourself to our listeners.

Thursday, 5 July 2018

Podcast Interview with Matt Casters, Neo4j & Kettle

A couple of years ago, I got to know another Belgian data aficionado that was doing quite a bit of work in the open source community, called Bart Maertens. For a while, we actually met at Antwerp Airport when we were both "commuting" to London City Airport for business - and we got a conversation going. Bart was organising a Pentaho Community Meeting in Antwerp, less than 500m from my home, and invited me to come along and talk a bit about my favourite subjects: beer and graphs :) ... 
So one thing lead to another, and Bart started to do some interesting work integrating his data integration tools with Neo4j. He wrote the code, and blogged about it in some detail

Fast forward to early 2018. Neo4j is more and more in the Enterprise market, with very large organisations seeing the value of graph databases and the platform around it. But most of these environments are NOT greenfield environments - they almost always require some kind of data integration work to make the tools work effectively. So it became very natural for us to start look for architects and experts that could help us... and that's effectively what brought my next Podcast guest to the Graph: Matt Casters has worked together with many other Neo4j people in a previous life, and is now the Chief Solutions Architect in our professional services organisation. 

Here's my chat with Matt:


Friday, 22 June 2018

Podcast Interview with Estelle Joubert, Dalhousie University

One of the coolest things about Neo4j is just the sheer breadth and diversity of applications that we see for connected data and graph databases out there. I think I have said it before, but it truly continues to baffle me. Very frequently, I will have a morning conversation with a user about battling financial fraud, a lunch conversation about using graphs in biotech to fight world hunger, and an afternoon conversation about real time recommender systems in retail. And of course finish it of with a beergraph conversation in the evening :) ...

Really - it's just amazing. And the next podcast episode is a true testimony to that. I got to have a chat with a lovely lady all the way over in Canada recently, Estelle Joubert from Dalhousie University. She and her team have been using Neo4j in her amazing field of research, which is all about understanding how music and opera came to be what they are today in a historical perspective. She is best at explaining it herself - so here's our chat:


Here's the transcript of our conversation:
RVB:  00:01:20.209 Hello, everyone. My name is Rik, Rik Van Bruggen from Neo4J, and tonight I am joined by a guest on our podcast all the way from Canada, someone that has been working with, and experimenting with, Neo4j for quite some time in a very interesting domain that I hadn't heard of before. And that's Estelle Joubert from Dalhousie University. Hi, Estelle.

Friday, 8 June 2018

Podcast interview with Jeffrey Miller, ICC

Here's a podcast episode that I have been wanting/needing to publish for a long time .Jeffrey A. Miller works as a Senior Consultant in Columbus, Ohio as a consultant in effective software development practices with lots of organisations. Jeffrey has delivered presentations at regional technical conferences and user groups on topics including Neo4j technology, knowledge management, and humanitarian healthcare projects - and that of course became a great setup for our conversation.


Also - I found this really interesting: Jeffrey and his wife, Brandy, are aspiring adoptive parents and have written a fun children’s book called “Skeeters” with proceeds supporting adoption. Learn more about the project at http://skeeterbooks.com/.

Friday, 18 May 2018

Podcast Interview with Iryna Feuerstein, Prodyna

Finally. It seems I am getting increasingly bad at getting great podcasts episodes that I have actually recorded a while ago, out there. This is one of them: I had a fantastic chat with Iryna Feuerstein from Prodyna some weeks ago. She has done some amazing talks on Neo4j, and on related subjects (like for example her work on toxicogenomics). So I am very happy to get this episode out there - and hope you will enjoy!

Here's the transcript of our conversation:
RVB: 00:00:02.736 Hello, everyone. My name is Rik Van Bruggen from Neo4j, and here I am on this wonderful Tuesday evening recording another podcast with someone from Germany, and that's Iryna Feuerstein from PRODYNA. Hi, Iryna.