Monday 16 December 2019

Part 3/3: Revisiting Hillary Clinton's email corpus with graph algos and NLP

(Note: this is Part 3 of this blogpost.  Part 1 and Part 2 are also published.)

Alright this is going to be the third and final part of my work on the Hillary Clinton Email Corpus. There's two posts that came before this article:
Now we are going to spent some time with the "heart of the matter", the actual content of the emails. We are going to do that in two steps: first we will do some "full text" querying of some data, using Neo4j's specific full text indexing capabilities. Then we are going to go a step further and try to extract more knowledge from this dataset in an automated way, by running some Natural Language Processing (NLP) algorithms and processes on it.

Let's get right to it.

Fulltext querying of Emails

Those of you that have been following Neo4j for some time, may remember that we have always bundled Apache Lucene with Neo4j. For the longest time, Neo4j used Lucene for it's indexing capabilities. This turned out to be a great choice for many things, but also one that had its limitations and trade-offs. This is why Neo4j has gradually been switching away from Lucene for its core schema indexing capability, and has adopted a modular, pluggable indexing architecture that allows for different indexing techniques to be used for different data types. This is great news for many reasons, but one of the most important benefits has been a dramatic increase in write performance - as the newer indexes are much more optimized and leaner than the older Lucene based structures. Read more about indexing in the Neo4j manual.

So as I started to think about some text-oriented queries, I quickly realised that I would need an index on Email text. So I wanted to do

create index on :Email(text)

and query that index afterwards. But the result was pretty obvious:


Part 2/3: Revisiting Hillary Clinton's email corpus with graph algos and NLP

(Note: this is Part 2 of this blogpost.  Part 1 and Part 3 are also published.)

In the previous post around the emails of Hillary Clinton, we were able to import the data from a CSV file, and use some really cool graph refactoring tools to make the database a little more easy to work with - bad data is bad data, and the less we have of that the better.

So we ended up in a reasonably stable state, where we could do some querying. In this post, we will do exactly that.

Exploring the graph with graph algos

It's fairly easy to get a good initial view of the structure and size of the graph. I just run a few queries like this:

//what nodes are in the db
match (n) return labels(n), count(n)

and: 

//what rels are in the db
MATCH p=()-[r]->() RETURN type(r), count(r)

and we very quickly see that, while this is clearly not a "big" dataset, it's still big enough to start loosing some significant time sifting through data if you want to make some sense of it. This is where our fantastic graph algorithms come in. I installed the plugin into my database, restarted it, and then I also played around a bit with Neuler, a graph algo playground that basically allows you to quickly experiment with different algorithms. You can download Neuler from https://install.graphapp.io/ and install it into your Neo4j Desktop really quickly.

Part 1/3: Revisiting Hillary Clinton's email corpus with graph algos and NLP

(Note: this is Part 1 of this blogpost. Part 2 and Part 3 are also published.)

With lots of interesting political manoeuvring going on in the USA and in Europe, I somehow got into a rabbit hole where I came across the corpus of emails that were published in the aftermath of the 2016 US presidential elections. They have been analysed a number of times, both by citizens and the press: see the great site published by the Wall Street Journal and Ben Hamner's github repo (which is based on a Kattle dataset).

Some of my friends and colleagues have also done some work on this dataset in Neo4j - there's  this graphgistLinkurio.us' blogpost, as well as Ryan Boyd's older article on DeveloperAdvocate. But I decided I was interested enough to take it for a spin.

Importing the email corpus into Neo4j

I got the dataset from this url, and it looks pretty straightforward. There's a very simple datamodel that we can work with, which would look something like this:


Monday 2 December 2019

Part 4/4: Playing with the Carrefour shopping receipts

(Note: this post is part of a series - Part 1Part 2Part 3Part 4 are all published!)

Alright here goes part 4 of 4 of my work on the Carrefour shopping receipts dataset. I realize we have come quite a way - and for me too there has been a lot to talk about and explore in these blogposts. Even then I feel like there's a ton of other interesting questions that we could ask and answer - but that would lead us too far.
Just to recap:


Now, in this final part of this series, I want to see if we can do some more analytical work with this dataset, for example by applying some algorithms to it. More specifically, I want to use some of our graph similarity algorithms to figure out which products are supposedly similar to one another - and do that along multiple axes. 

People have written long and complicated doctorates about the best way to calculate and establish similarities in graphs - and most of it is very much beyond me and my reptile math brain. But one thing is clear: many of the algorithms have very different approaches to doing this, and there are good reasons for wanting to choose or abandon one or the other. However, in our daily Neo4j work, we have seen some particularly interesting results with the Jaccard similarity algorithm, which is part of the algos plugin to Neo4j.

Jaccard similarity

The simple explanation of what Jaccard similarity does, is that it calculates a coefficient that compares members of two sets to see which members are shared and which are very different. So it's a measure of similarity for two sets of data - with a range from 0% (not similar at all) to 100% (identical). Higher scores mean higher similarity between the two populations. Jaccard similarity is sometimes referred to as "Intersection over Union", as explained like this:


I borrowed most of this explanation from the inevitable Wikipedia of course. You can find the Neo4j algo library that contains this algorithm over here.

Friday 29 November 2019

Part 3/4: Playing with the Carrefour shopping receipts

(Note: this post is part of a series - Part 1Part 2Part 3Part 4 are all published!)

Alright here goes part 3 of 4 of my work on the Carrefour shopping receipts dataset.

In part 1 I wrangled the data, and imported it into Neo4j. In part 2 I was doing some simple but interesting queries on the data, just to get our feet wet and get a feel for the dataset. Now in this article I want to do some more interesting work - specifically around product combinations. Which products are being bought together? Who is buying which combinations together? You can just sense that this would be some interesting stuff.

And I must say that this was quite an interesting "assignment". Originally, I wanted to actually look at all the combinations of products that we found in our dataset, and I wrote a nice little query for it:

//PLEASE DON'T RUN THIS QUERY!!!
call apoc.periodic.iterate("
match (p1:Product)<-[:TICKET_HAS_PRODUCT]-(t:Ticket)-[:TICKET_HAS_PRODUCT]->(p2:Product)
where id(p1)>id(p2)
return p1, p2","
merge (pc:ProductCombo {combo: p1.description+ ' with '+ p2.description, product1: p1.description, product2: p2.description})
on create set pc.frequency = 1
on match set pc.frequency = pc.frequency + 1
",
{batchsize:50000, iterateList: true, parallel: false})

In theory, this works just fine - and the db starts churning away and writing back ProductCombo nodes - but it never finishes. Or maybe I lost my patience :) ... but then I realised that the math is very much working against me: I have 53588 products in this dataset. If I remember my maths correctly, that means that
nCr = n(n - 1)(n - 2) ... (n - r + 1)/r! = n! / r!(n - r)!
I would have 53588! / (2! * 53586!) = 1435810078 combinations of products possible. See the StatTrek website for the calculator :) ... on top of that I realised that ALL of these combinations are probably not that interesting for us - maybe we should try to make this a bit more specific?


Thursday 28 November 2019

Part 2/4: Playing with the Carrefour shopping receipts

(Note: this post is part of a series - Part 1Part 2Part 3Part 4 are all published!)

In the previous article in this series, we had started to play around with the Carrefour shopping receipts dataset that I found from a hackathon in 2016. It's a pretty cool dataset, and with some text wizardry and some Neo4j procedures, we quickly had a running database of Tickets, TicketItems, Clients, Malls and Products. The model looks like this:
In summary, we have
  • about 585k shopping tickets in the dataset, 
  • that hold about 6.8M ticketitems (so 11-12 ticketitems/ticket, on average)
  • from 2 different Carrefour malls, 
  • from 66k different Carrefour clients
  • with about 53k different products
This clearly is not "big data" yet, but it's big enough to be interesting and to have a bit of a meaningful play with. So let's run some queries!

Wednesday 27 November 2019

Part 1/4: Playing with the Carrefour shopping receipts

(Note: this post is part of a series - Part 1Part 2Part 3Part 4 are all published!)

Alright here we go again. In an effort to do some more writing, blogging, podcasting, for our wonderful Neo4j community, I wanted to get back into a routine of playing with some more datasets in Neo4j. A couple of weeks ago I was able to play a bit with a small dataset from Colruyt Group, and I wrote about it over here. And I don't know exactly how it happened, but in some weird way I got my hand on another retailer's data assignment - this time from Carrefour.

You will notice that this will be another series of blogs: there's just too much stuff here to put into one simple post. So after having done all the technical prep for this article, it seems most logical to split it into 4 parts:

  1. part 1 (this article) will cover the the data modeling, the import of the dataset, and some minor wrangling to get the dataset into a workable format.
  2. part 2 (to follow) will cover a couple of cool queries to acquaint ourselves with the dataset.
  3. part 3 (to follow) will cover a specific - and quite complicated - investigation into the product combinations that people have been buying at Carrefour - to see if we can find some patterns in there.
  4. part 4 (to follow - and this is the final part) will look at some simple graph algorithms for analytics that we ran.

That should be plenty of fun for all of us. So let's get right into it.

The Carrefour Basket dataset

As I finished up the Colruyt article referenced above, I was actually originally just looking for some spatial information on other supermarket chain's positioning of shops in Belgium. I wanted to see if I could create some simple overlay views of where which shops were - and started browsing the interweb for data on supermarket locations. That very quickly lead to something completely different: I found this website for TADHack Global ("Telecom Application Developer Hackathon", apparently is what it stands for), a 2016 event where people could investigate different datasets and use it to hack together some cool stuff. In that 2016 event, there was an assignment from Carrefour: the Carrefour Delighting Customers Challenge Basket Data set.

Tuesday 12 November 2019

Playing with the Colruyt Data Science assignment

If you spend any time in the Wonderful World of Graphs, I am sure you have noticed that the landscape has been changing in the past few years. I have definitely seen a change: the interest in using graphs has shifted from wanting to use graph databases for "data retrieval" purposes, to now also wanting to make use of it ton "make sense of" the data - basically doing data analytics. Of course data retrieval and data analysis are related, and in many cases we nowadays talk about all of this under the umbrella of data science. Sounds great, and at Neo4j we have made fantastic strides in making new functionality (think the Algo library that you can install on every Neo4j server, or think the Neuler graphapp that makes using the Algo library a walk in the park) available to enable these workloads - a work in progress that will only accelerate.

Thursday 7 November 2019

Graphistania 2.0 - Episode 1 - This Month in Neo4j

Hello everyone!

it has been deadly quiet on this page, hasn't it. That's really oh so true, and I am / was not happy with that. This blog, the podcast, and everything around has always been my humble contribution to our awesome Neo4j community, and in the past 6+ month or so, I have not been doing my part. Sorry for that. Lots of excuses that I will not bore you with, but I am going to try to do better.

Part of the reason for the silence was of course that I thought that the podcast formula (in which I always asked for the three same basic things: who are you, why graphs, what's coming in the future) had kind of run its course. 100+ episodes had given me lots of fantastic conversations, but it was time to move on. I needed a new formula.

A couple of weeks ago, while doing absolutely NOTHING graph related - unless you want to imagine a graph of a bathroom, a shower, soap, and yours truly - I came up with an idea. What if we did episodes about all of the cool, innovative things that are popping up in our community on a daily basis? Sure. But where could I find those? Well, on the Neo4j developer relations "This week in Neo4j" (TWIN4J) newsletter probably, right! But who would I talk to that about? Well... this is where I found a great partner in crime. I thought about one of my most creative colleagues, someone who is paid to be creative and is really good at it - and came up with noone other than Stefan Wendin. Stefan leads our Innovation Labs in EMEA, and has presented on that topic extensively in the past.


So we have lots of innovation. We have someone who KNOWS a lot about innovation. So let's then have a chat about some of these innovative graph database applications, shall we? Here goes.


Wednesday 3 July 2019

Finally: someone interviewed me on their podcast

This is worth a small celebration. Super conversation (in Dutch) with Jurjen Helmus, Walter van der Scheer and wingman Ron van Weverwijk on the Dataloog podcast about the use of graph databases and Neo4j. Listen to it over here over here - or find it on itunes/spotify.


Lots of fun to do - hope you enjoy it as much too!

Cheers

Rik

Tuesday 26 March 2019

Podcast Interview with János Szendi-Varga, GraphAware

Finally - managed to get out another episode of our podcast. Early February, our friends of GraphAware published a great blogpost about their view of the "Graph Technology Landscape". The main author János Szendi-Varga, was kind enough to spend some time with me on the phone talking about our industry and where it's going. Hope you enjoy it as much as I did!


Here's the transcript of our conversation:
RVB: 00:00:03.184 Hello everyone. My name is Rik, Rik Van Bruggen from Neo4j, and here we are again recording another episode of the Graphistania, Neo4j graph database podcast. And today I have a special guest on the podcast all the way from the UAE in the Middle East and that's a very, very interesting person that did some amazing work recently with the graph database landscape. It's János Szendi-Varga. Hi János.

Tuesday 26 February 2019

Podcast Interview with Amy Hodler, Neo4j

Yes! Another great interview for our podcast, this time with a great colleague of mine who has a big mind and many ideas around one of the most fascinating and under-used topics evah: Graph Algorithms and Artificial Intelligence. Amy Hodler has a lot to say on this topic, and is about to publish a fantastic new book on the topic together with Mark Needham. I think you will enjoy this one - even though it's a bit longer than usual. Here goes:


Here's the transcript of our conversation:
RVB:  00:00:00.938 Hello, everyone. My name is Rik, Rik Van Bruggen from Neo4j, and here we are again, recording another episode of our Graphistania Graph Database Podcast. And tonight I have a dear colleague of mine on the other side of this Google call, and that's Amy Hodler. Amy, how are you?

Thursday 7 February 2019

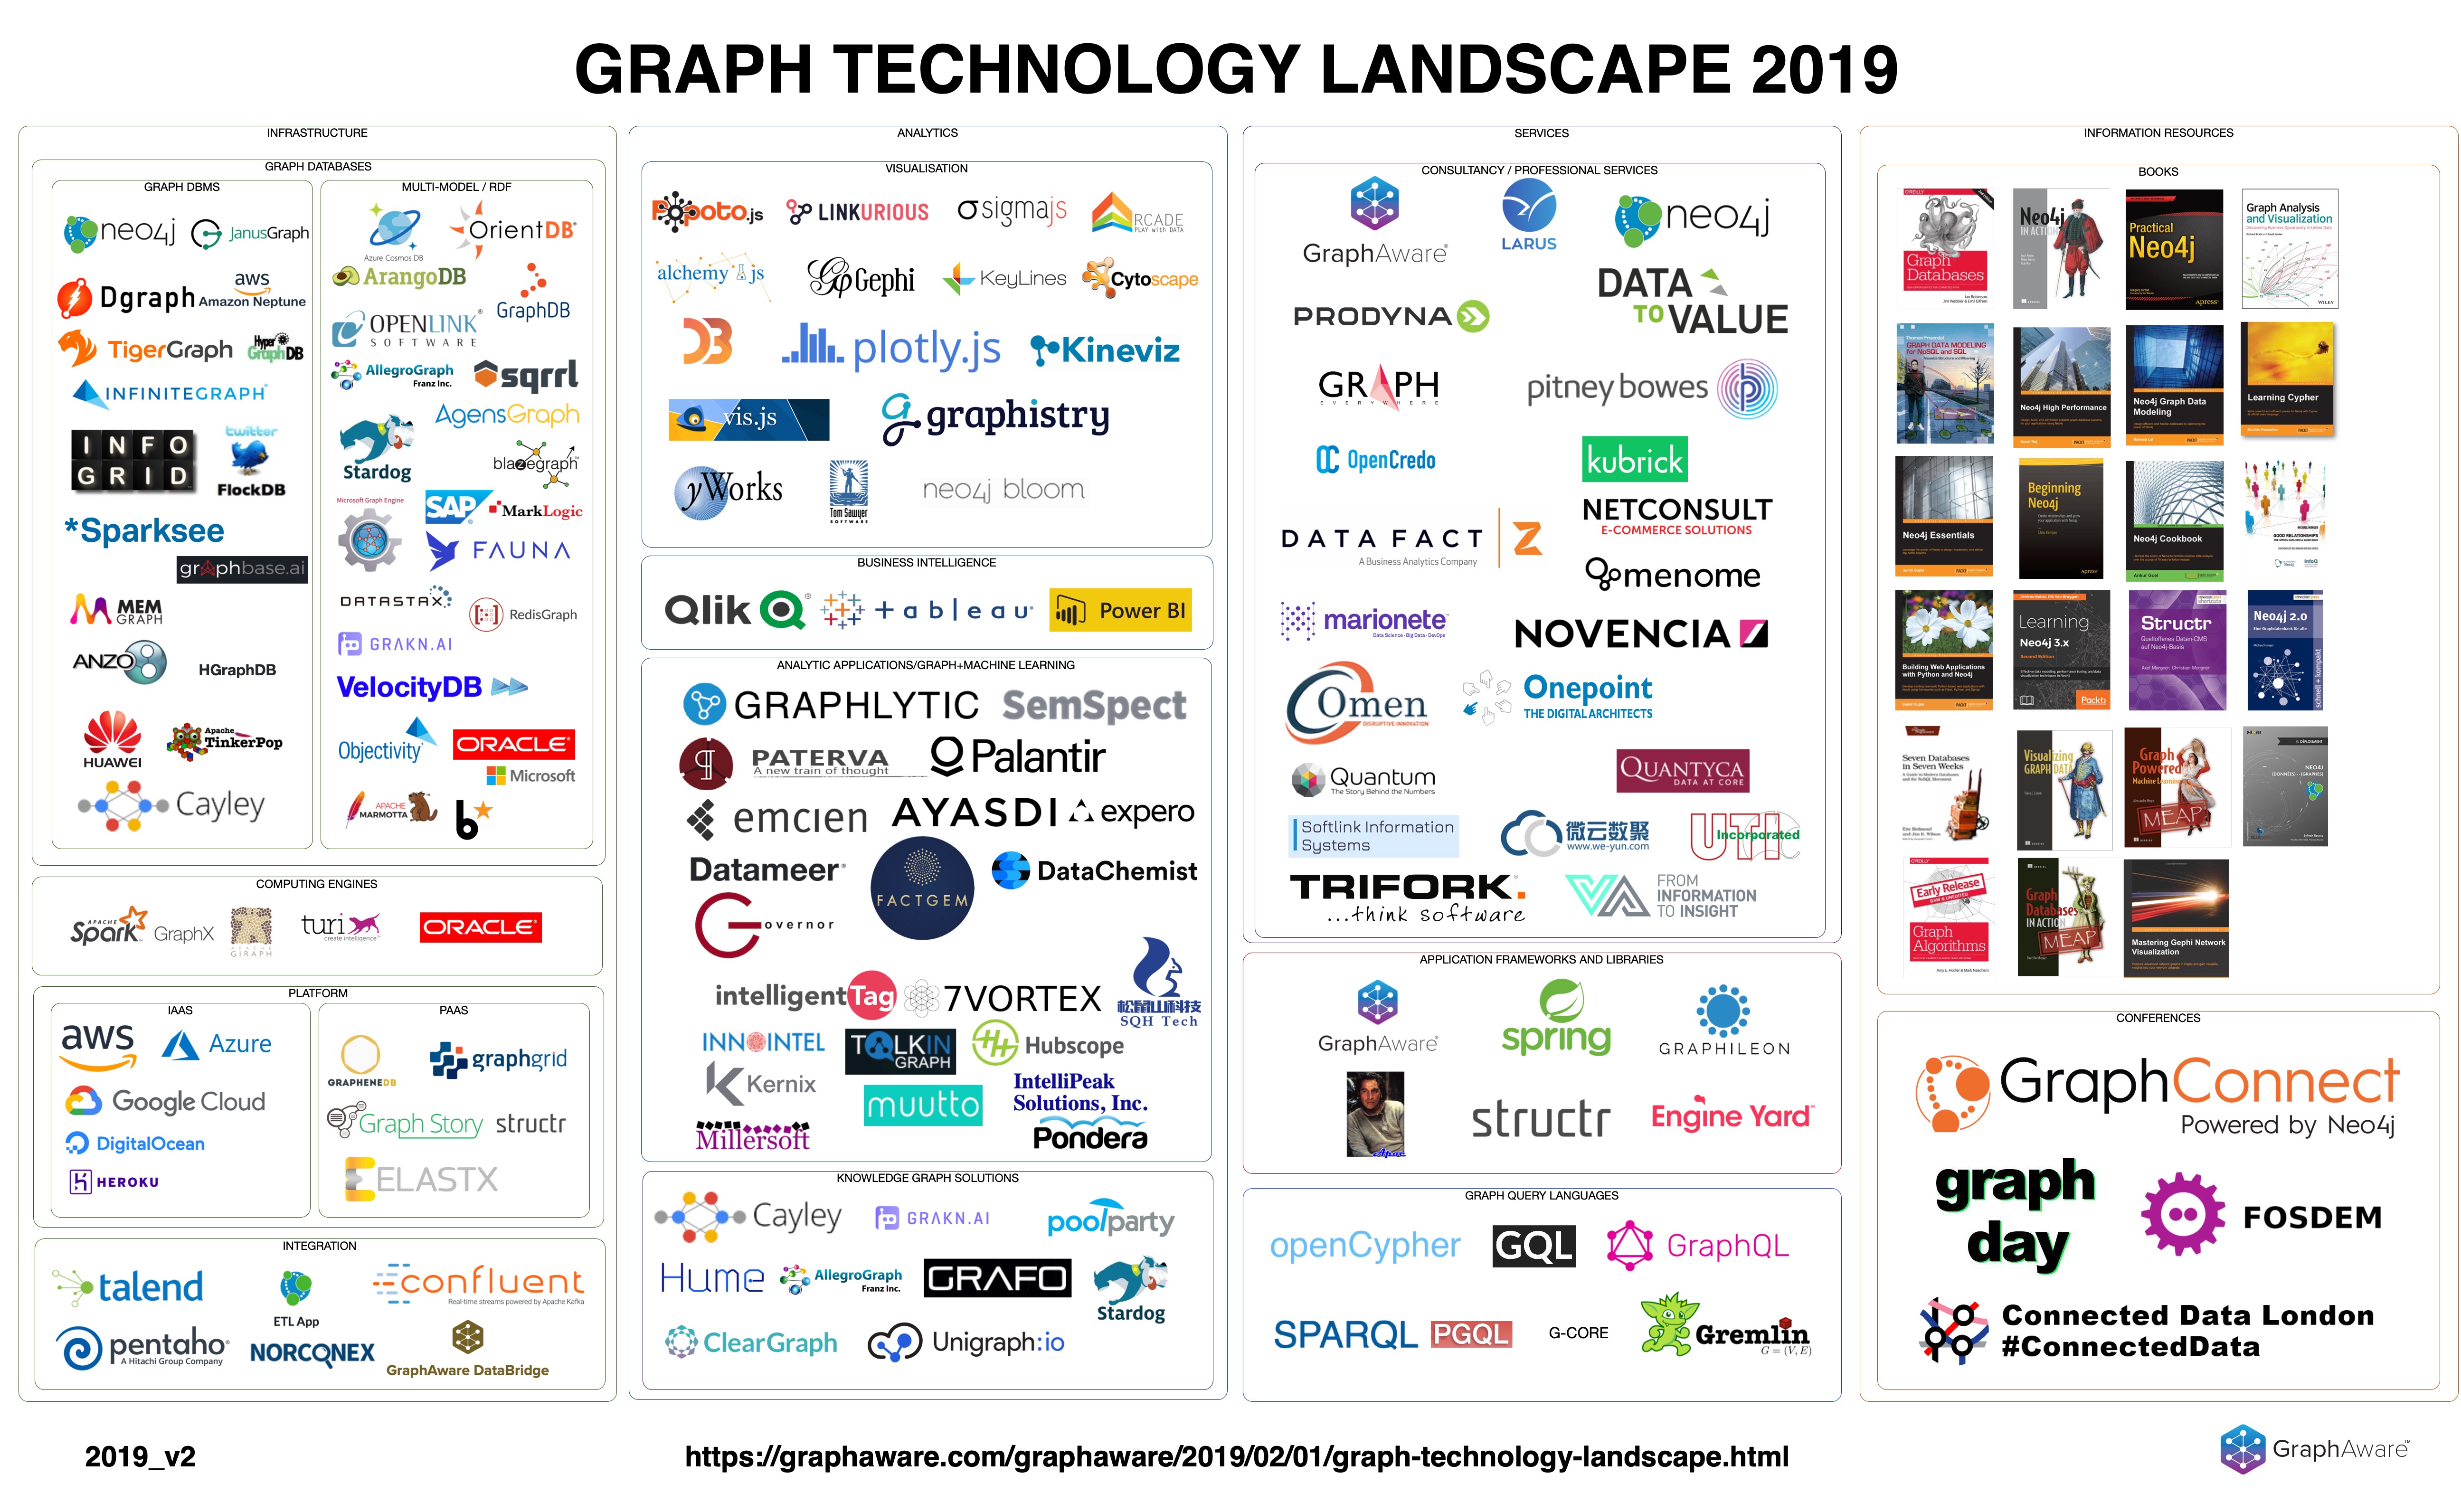
The Graph Technology Landscape Graph

Our friends at Graphaware, and specifically Janos Szendi-Varga created a fantastic overview of the Graph Technology Landscape in 2019. It's actually pretty cool:
There's lots of interesting data in there, which Janos put into a CSV file over here. I thought that was really cool, and took the data for a spin in a Google Sheet, and then modified it a little bit from there.

Next thing for me was to create a

Which I have now made available as an import script and a graphgist over here. You can explore the data in the deployed graphgist yourself, and figure out some of the hidden and not-so-hidden connections in the Graph Technology Landscape. 

Hope you will have as much fun with this as I had.

Cheers

Rik

Tuesday 5 February 2019

Podcast Interview with Jess Mason and Jason Cox, Untiltled Folder

Yeah,  I think I am going to repeat myself. Another podcast that was long overdue waiting to be published. I interviewed my next guests middle of December 2018, and it's hard to believe that I only just MADE the time to publish the episode. My bad - again. It's another great chat though - so you should still listen and look at some of the very cool links included below - you will not regret it. Jess and Jason are doing some amazing stuff with Neo4j over in Philly, and check it out. Here it goes:


Here's the transcript of our conversation:
RVB: 00:00:26.434 Hello, everyone. My name is Rik, Rik Van Bruggen from Neo4j, and here I am, again, recording another Neo4j Graph Database Graphistania Podcast. And tonight I am joined by two guys from Philadelphia in the USA that have been doing some amazing work with Neo4j. And on top of that, they have the funniest company name, I think at least. It's called Untitled Folder. That's Jess and Jason. Jess and Jason, welcome to the podcast.

JM: 00:01:04.071 Hi. Thanks for having us on the podcast.

JC: 00:01:04.525 Hello.