Monday, 26 February 2018

Podcast Interview with Jonathan Schmidt, Waykonect

Here's another cool user story for you. I had a great chat with Jonathan Schmidt, founder and CTO of a great French startup called Waykonect that offers intelligent vehicle management based on Neo4j. They have been doing some really smart stuff and the use case seems like such a great fit for a graph - it's like a hand in glove. Listen to his story - it's very cool.


Here's the transcript of our conversation:
RVB: 00:00:01.221 Good morning, everyone. My name is Rik. Rik Van Bruggen from Neo4j. And here I am recording another Graphistania Neo4j podcast. And this morning I have got, well, someone not too far away from me on the other side of this call, and that's Jonathan Schmidt from WayKonect. Hello, Jonathan. 
JS: 00:00:23.314 Hello, Rik. 
RVB: 00:00:23.952 Hi. Thank you for joining me. 
JS: 00:00:26.779 Welcome. It's a pleasure to be here.
RVB: 00:00:28.886 Fantastic. Jonathan, we've been emailing back and forth, and you've been talking to me about your project with Neo4j, but most people probably don't know you, yet. So if you could perhaps introduce yourself a little bit. Who are you, and what do you do, and what's your relationship to the wonderful world of graphs? 
JS: 00:00:48.982 All right. Well, I'm Jonathan Schmidt. I'm CTO and cofounder of WayKonect. We are a fleet management company. Telematics fleet management. Our focus is data analysis, actionable intelligence from your vehicles, and we take a very driver-oriented approach to the field. Our belief is that you have to engage drivers if you want any kind of savings, any kind of actions to be successful on your fleet. So that's what we do. Analysing data and engaging drivers. 
RVB: 00:01:29.005 When you say fleet management that means lease cars or it means-- what is the fleet for you? Is it any kind of rolling material, or what is it? 
JS: 00:01:38.584 We mostly focus on small, light vehicles. So cars, mostly, small trucks, that kind of thing. 
RVB: 00:01:52.184 Okay. Very good. And then how does it work, and how does that work with the graph as well, potentially? Could you explain that to us? 
JS: 00:01:59.999 Sure. Well, we have telematics dongle that actually give back a lot of flow data about vehicles. And we use graphs to map the relationship between dongle, the vehicle, the account that manages the vehicle, the driver that drives the vehicle, the trips that are recorded, events that might happen on that trip, the maintenance of the vehicle. Basically, we use Neo4j as our metre graph for information. Everything that we collect from the data is stored and recorded in Neo4j in a graph style, which actually allows us to analyse it very quickly, very efficiently because we can link multiple things together, multiple items together, and get very interesting intelligence from it. And it also gives us flexibility to innovate, to improve over time because it's a NoSQL model. So when we need another kind of item to track down, when we need another kind of-- or should I say-- 
RVB: 00:03:16.511 A property or a relationship or whatever. 
JS: 00:03:17.789 A property, relationship, real-world object, a new feature that we want to track, we started checking and keeping track of maintenance for our vehicles. And that was just a new level, new relationships, and that's it. And from maintenance, came appointments, came markers on the map to-- so when was the appointment, where's located, came reviews on these repair shops, came-- and all of this just flows out naturally in the graph. And it gives us flexibility to improve, and the flexibility to analyse very efficiently. 
RVB: 00:04:02.049 Wow. That's really cool. So your model has been evolving a little bit as you had more requirements, agile development, those types of things? Is that what I'm hearing? 
JS: 00:04:11.271 Indeed. Indeed. It's evolving constantly and basically every month or every two months we add one, two new labels to the graph, new relationships and new way to actually get insight from the data. 
RVB: 00:04:24.217 Wow. Cool. And are there any other data components to your application that you're using? Analytical components or other database stores, or is it mostly Neo4j? 
JS: 00:04:36.157 Neo4j is our metadata store, so everything we get out from the data is new. For the raw data itself, we actually use InfluxDB as a time series repository. And we are also using Kafka as a messaging backbone for the whole infrastructure and so that all of our services can analyse the data as it comes in. 
RVB: 00:05:04.584 Yeah. That's sounds like a great idea. Great architecture. So can you talk to us a little bit about how you got to Neo4j and why you started using a graph for this? What's the main advantage to it for you? 
JS: 00:05:18.219 Well, our first proof of concept was obviously [laughter] built on SQL. That panned out good for a few vehicles, for the 100 or so vehicles we had in the test, and but my belief was that it was untenable at scale, storing telemetries, storing raw data, and the metadata in SQL was going to be a nightmare whenever joints would be involved. And I mean, whenever you want a trip, you have to join the accounts that the vehicle belongs to, the vehicle itself, the trip, some events that might be off-scoring but may be related to it, and it's three, four, five-part joints on every request. And that would quickly become problematic. And when I started devising our data model, I had an engineer with me who said, "Actually, this makes me think of graphs and maybe we should check out the field of graph databases." And it basically started this way. We checked a few graph databases, settled on Neo, because it seemed to be the best fit for architecture and in terms of maturity, in terms of functionality. And we did a first proof of concept with the new project client in C# because our whole architecture's on .NET and it was just so easy. You create a class, you put in properties, and you can [inaudible] in one message, and relationships comes at almost no additional costs. 
RVB: 00:07:19.950 That's fantastic to hear. I mean, it sounds like a great [crosstalk]. 
JS: 00:07:23.237 Yeah. It was just so easy, so fitting, it stuck. And it's a choice I've never ever regretted making. Our transition to Neo4j was, I believe today, one of the best decision we ever made. 
RVB: 00:07:43.778 Wow. There must be something wrong with it [laughter]. 
JS: 00:07:47.867 Well, we had a few, of course, there was a few problems along the way, but mostly it came from our data model. We had a few issues with transactions and HAProxy because we are on an enterprise high-availability cluster. So routing transaction correctly from slave to master or keeping a transaction on the same server is a bit of challenge sometimes. But other than that most of our troubles was because we didn't understand technology at first and we actually built it as we learned. And we've made a few mistakes in model along the way and it was actually incredibly easy to smooth them out at a later time to refactor the graph. And that was also something that clenched it for me. I mean, you identify and isolate the problem, you refactor in one or two codes and a few change in your code and that's it, problem solved. That's just so easy. 
RVB: 00:09:07.273 Excellent. Well, that was kind of the past, right? So what does the future look like? How do you plan to use it in the future? How do you plan to evolve your application and also maybe any perspectives on what the industry is going to be doing on this? 
JS: 00:09:28.361 Well, as for us, my next step is [inaudible] clustering and I'm just a few steps away from having it work correctly [laughter]. Currently having a bit of dependency problems with dot net. But [laughter] that's something that should be easily solved and [crosstalk]. 
RVB: 00:09:50.075 I hope so. Otherwise, you know where to find us, right [laughter]?
JS: 00:09:52.654 Exactly. And I think [inaudible] clustering will be the next big step and what will take us from really scalable to infinitely scalable [laughter], I guess. As far as the industry, well, it's a bit-- as much as you-- when you start using graph databases, you start seeing application for them everywhere. Even up to research in ancient languages. You can probably index and cross-reference hundreds of texts in minutes or hours just because you can actually cross-reference words and phrase from it. And the language doesn't matter as long as you have a [unique alphabet?] for it. And this is so powerful and it's just one application off the top of my head because I double in that on the side. But-- 
RVB: 00:11:00.404 Graphs are everywhere, right? 
JS: 00:11:01.883 Graphs are everywhere.
RVB: 00:11:02.063 Once [laughter] you start getting into the mindset you start to see them everywhere and that's so fascinating. 
JS: 00:11:10.033 And you start to see also what good they could do. You have so many people building complicated software just to solve graph-related question that could be solved in a few Cypher queries and at the time port, so. 
RVB: 00:11:28.278 Couldn't agree more, Jonathan. I think we're on the same page there. Absolutely. Thank you for sharing your experience with us. I think that was super nice and super useful for lots of people. We'll put some links to your company and your experience in the transcription of the podcast. But for now, this is I guess where we're going to be wrapping up. Thank you so much for coming online, really appreciate it. And I look forward to meeting you soon sometime. 
JS: 00:11:58.764 You're welcome. It was a pleasure. And please, feel free to drop by just give me a holler one point. And, yeah, we can meet definitely. 
RVB: 00:12:07.894 Fantastic. Thank you, Jonathan. Have a nice day. 
JS: 00:12:10.741 Have a nice day. And thank you, Rik. 
RVB: 00:12:12.138 Bye.
Subscribing to the podcast is easy: just add the rss feed or add us in iTunes! Hope you'll enjoy it!

All the best

Rik

Labels: , , , , , , , , , , , , , , ,

Saturday, 15 November 2014

The IDMS EmpDemo - reloaded

A couple of weeks ago, I told the story of the interesting conversation that I had had with Luc Hermans about the similarities between IDMS and Neo4j. Luc gave me access to the EmpDemo dataset that ships with IDMS, and I sort of challenged myself saying that I would love to revisit his 2012 effort to import the data into Neo4j and do some queries on it. Not to see if you could migrate data from IDMS to Neo4j (that would be WAY more complicated, with all the software dependencies, of course), but just to explore the model similarities.

Now, several weeks later, I have something to show you. It's not always very pretty, but here goes :) ...

The IDMS schema file & sequential data

The IDMS input data was essentially structured in two files.
  1. The schema file. This file was pretty long and complicated, and describes the structure of the actual data records. Here's an excerpt for the "Coverage" data records:
     RECORD NAME IS COVERAGE  
          SHARE STRUCTURE OF RECORD COVERAGE VERSION 100  
          RECORD ID IS 400  
          LOCATION MODE IS VIA EMP-COVERAGE SET  
          WITHIN AREA INS-DEMO-REGION OFFSET 5 PAGES FOR 45 PAGES  
     *+    RECORD NAME SYNONYM IS COVERGE FOR LANGUAGE ASSEMBLER  
     *+    RECORD NAME SYNONYM IS COVRGE FOR LANGUAGE FORTRAN  
     *+    OWNER OF SET COVERAGE-CLAIMS  
     *+      NEXT DBKEY POSITION IS 4  
     *+      PRIOR DBKEY POSITION IS 5  
     *+    MEMBER OF SET EMP-COVERAGE  
     *+      NEXT DBKEY POSITION IS 1  
     *+      PRIOR DBKEY POSITION IS 2  
     *+      OWNER DBKEY POSITION IS 3  
          .  
     *+  02 SELECTION-DATE-0400  
     *+    USAGE IS DISPLAY  
     *+    ELEMENT LENGTH IS 8  
     *+    POSITION IS 1  
     *+    ELEMENT NAME SYNONYM FOR LANGUAGE ASSEMBLER IS COVSELDT  
     *+    ELEMENT NAME SYNONYM FOR LANGUAGE FORTRAN IS CVSLDT  
     *+    .  
    
    As you can see it is all about the "positions" of the data in the file: where does the record start, where do the fields in the record start and end - in the sequential file.
  2. The sequential file itself was a lot shorter in this case (it is just a small dataset). The coverage records mentioned above look something like this.
     C 00303011978110100000000F003  
      C 00403011975030100000000D004  
      C 00200031977012100000000M002  
      C 00400071978043000000000F004  
      C 00100111980092900000000M001  
      C 00200131981010200000000D002  
      C 00100161978010600000000M001  
    
    As you can see, all it is is a sequence of ASCII numbers that then need to be split up into the different fields, as defined in the schema above. Interesting. 
Unfortunately I can't share the actual files in public - but the above should give you a good idea what I started from.

Struggling with Sequential files - not my forte

Once I grasped these file structures a little bit, I continued to see how I could work with them to create an "importable" format for my Neo4j server. Turned out that was not that easy. I ended up using a two part process:


  1. I used a spreadsheet to convert the individual records into structured fields that I could work with. Here's the link to the google doc, if you're interested. Google Sheets has a function called "mid", that allows you to pick contents from a cell's sequential positions:

    which was exactly what I needed to do. Once I ficured that out, it was pretty easy to create the nodes in my Neo4j server. But how to extract the relationships???
  2. Turns out that I really did not manage to do that. I had to turn to Luc for help, and he basically managed to create a CSV file that used record IDs as the key to establish the relationships. Not pretty - and I still have no clue how he did that (let's just attribute it to the secret art of mainframe wizardry :)), but it did work...
Once I had this all I had to do was to use the structured information in my spreadsheet to generate cypher statements that would allow me to create the graph in Neo4j. That was easy. You can find the statements over here.

Updating the IDMS model to Neo4j

As I already mentioned in the previous blogpost, the similarities between IDMS and Neo4j data models are multiple, but there are also some differences. One of the most striking ones - for me at least - was how IDMS deals with many-to-many cardinalities in the data model. Including these types of relationships in IDMS requires the creation of a separate kind of "record", called a "Junction record". This is a the best explanation that I found over here:
For each many-to-many relationship between two entities, we will almost always identify additional attributes that are not associated with either of the two entities alone, but are associated with the intersection between the two entity types. This intersection is represented by another record type, called junction record type, which has one-to-many relationships with the two entity types. The junction record resolves the many-to-many relationship and implements this many-to-many relationship indirectly. 
Thinking about this some more: junction records are very similar to the relational database concept of a "join table". And as we know, we don't need stuff like that in Neo4j, as you can natively create these kinds of n to m relationships in Neo4j without having to think twice.

So that means that we need to make some updates to the data model, as Luc had already done in his effort. You can clearly see what needs to be done in the figure below:

In the IDMS data model we have three junction records:
  • the Emposition: relating the Employees to their jobs
  • the Expertise: relating the Employees to their skills
  • the Structure: creating a reporting line / managerial relationship between two employees.
So we need to write a Cypher statement that would update the graph accordingly. Here's an example of how I did that for the relationship between Employee and Job:

 //create direct link between employee and job (removing need for "Emposition" juncture record)  
 match (e:Employee)-[r1]-(emp:Emposition)-[r2]-(j:Job)  
 create (e)-[r:JOB_EMPLOYEE]->(j)  
 set r.EmpID=emp.EmpID  
 set r.StartDate=emp.StartDate  
 set r.BonusPercent=emp.BonusPercent  
 set r.SalaryAmount=emp.SalaryAmount  
 set r.OvertimeRate=emp.OvertimeRate  
 set r.EmpositionCode=emp.EmpositionCode  
 set r.CommissionPercent=emp.CommissionPercent  
 set r.FinishDate=emp.FinishDate  
 set r.SalaryGrade=emp.SalaryGrade;  
 //delete the redundant structure  
 //delete r1,r2,emp  

Note that the properties of the junction record (eg. startdate, salary, and others) are now moved from the junction record to a relationship property. Property graphs make relationships equal citizens, don't they! The full update statements that I created are over here. I have put the graph.db folder over here if you want to take if for a spin yourself.

So now, let's do some querying of this dataset with Cypher!

Querying the Reloaded EmpDemo with Cypher

One of the key differences between IDMS and Neo4j seems to be to me that we now have this wonderful query language at our fingertips to explore the network data. IDMS does have some query facilities (using a SQL overlay on top of native IDMS, as I understand it), but it seems to me like the Neo4j approach is a lot more flexible.

Here are some example queries:

 //what's in the dataset  
 match (n)  
 return labels(n), count(n)  
 order by count(n) DESC;  

Gives you the following result:

Or lets do some deeper queries:

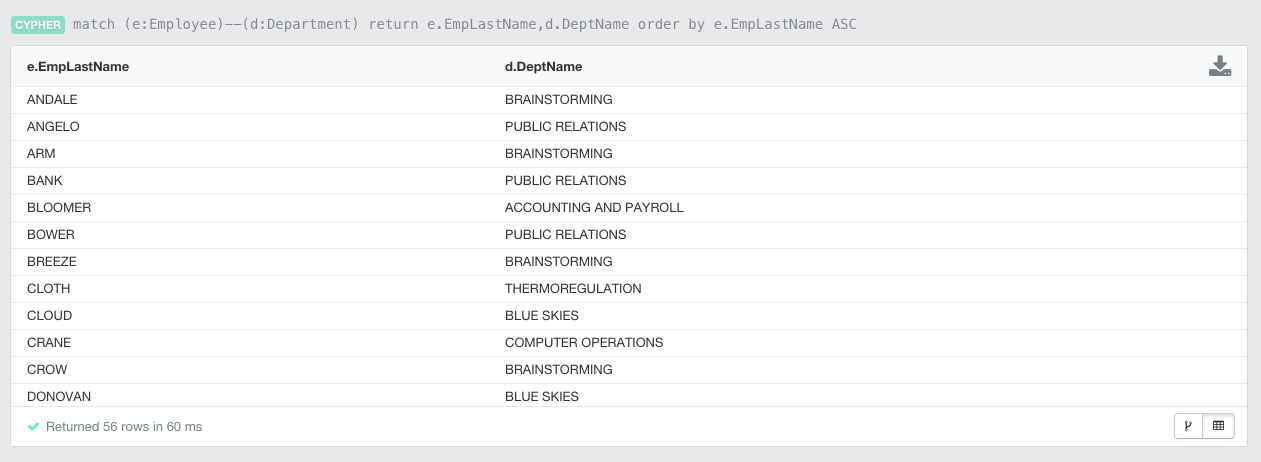
 //Show employee and departments  
 match (e:Employee)--(d:Department)   
 return e.EmpLastName,d.DeptName   
 order by e.EmpLastName ASC  

Gives you:
Of course we can also look at some more graphical representations of our newly reloaded EmpDemo.  To illustrate this, let's look for some shortestpaths between Departments and Skills (bypassing the junction records that we mentioned above):

 //Paths between departments and skills  
 match p=Allshortestpaths((d:Department)-[*]-(s:Skill))   
 return p  
 limit 5;  

This gives you the following result:
Or similarly, let's look for the paths between departments and the different types of claims. This is a bit more interesting, as have different kinds of claims (Dental, Hospital, and Non-Hospital) which currently all have different labels in our data model. We can however, identify them as they all have the same "COVERAGE_CLAIMS" relationship type between the coverage and the different kinds of claims. So that's how the following query was split into two parts:

 //paths between departments and claims  
 match (c)-[ccl:COVERAGE_CLAIMS]-(claim)  
 with c, claim  
 match p=Allshortestpaths((d:Department)-[*]-(c:Coverage))  
 return p,claim  
 limit 1;  

First we look for the Coverage "c" and the Claims "claim" and then we use the AllShortestPaths function to get the links between the departments and the coverage. Running this gives you this (limited to 1 example):

Finally, let's do one more query looking at a broad section of the graph that explores the Employees, Skills and Jobs in one particular department ("EXECUTIVE ADMINISTRATION"). The query is quite simple:

 //Employees, Skills and Jobs in the "Executive Administration" department  
 match p=((d:Department {DeptName:"EXECUTIVE ADMINISTRATION"})--(e:Employee)--(s:Skill)),  
 (e)--(j:Job)  
 return p,j;  

and the result gives you a good view of what goes on in this department:

Obviously you can come up with lots of other queries - just play around with it if you feel like it :)

Wrapping up

This was a very interesting exercise for me. I always knew about the conceptual similarities between Codasyl databases and Neo4j, but I never got to feel it as closely as with this exercise. It feels as if Neo4j - with all its imperfections and limitations that make it probably so much less mature than IDMS today - still does offer some interesting features in terms of flexibility and query capabilities. 

It's as if our industry is going full circle and revisiting the model of the original databases (like IDMS), but enhancing it with some of the expressive query capabilities brought to us by relational databases in the form of SQL. All in all, it does sort of reinforce the image in my mind at least that this really is super interesting and powerful stuff. The network/graph model for data is just fantastic, and if we can make that easily accessible and flexibly usable with tools like Neo4j, the industry can only win. 

Hope this was as useful and interesting for you as it was for me :) ... as always: comments more than welcome.

Cheers

Rik

Labels: , , , , , , ,