Rambling thoughts about life in and around the data industry
Monday, 22 November 2021
The Quest for Graphalue - ENCORE - the Total Economic Impact session
We did not really plan for it, but we decided to add another "encore" session to our podcast series about Graph Value on www.graphalue.com. Me and my "partner in virtue" (as opposed to: crime :) ) Stefan Wendin have just a published a sixth and (promise!) last episode in our exploration on finding, defining, documenting, presenting and achieving Graph Value.
This episode is discussing the fascinating report that was released recently about the "Total Economic Impact" (TEI) of Neo4j's graph data platform. Forrester Research delivered an independent and objective analysis of this impact based on a number of detailed and specific customer implementations.
The Quest for Graphalue - episode 5 and ending of a Podcast Series on Graph Value
Please take a look at the 5th episode, and our concluding notes, in our podcast series about Graph Value on www.graphalue.com. Me and my "partner in virtue" (as opposed to: crime :) ) Stefan Wendin have just a published a fifth and last episode in our exploration on finding, defining, documenting, presenting and achieving Graph Value. You should check it out!
Episode 5 is over here, and the concluding notes are over here! Enjoy!
The Quest for Graphalue - episode 4 of a Podcast Series on Graph Value
Please take a look at the 4th episode in our podcast series about Graph Value on www.graphalue.com. Me and my partner in crime Stefan Wendin have just a published a fourth episode in our exploration on finding, defining, documenting, presenting and achieving Graph Value. You should check it out!
The Quest for Graphalue - episode 3 of a Podcast Series on Graph Value
Please take a look at the 3rd episode in our new podcast series about Graph Value on www.graphalue.com. Me and my partner in crime Stefan Wendin have just a published a third episode in the new podcast series on finding, defining, documenting, presenting and achieving Graph Value. You should check it out!
The Quest for Graphalue - episode 2 of a our Podcast Series on Graph Value
Please take a look at the 2nd episode in our new podcast series about Graph Value on www.graphalue.com. Me and my partner in crime Stefan Wendin have just a published a second episode in the new podcast series on finding, defining, documenting, presenting and achieving Graph Value. You should check it out!
The Quest for Graphalue - episode 1 of a new Podcast Series on Graph Value
Please take a look at our new podcast series on www.graphalue.com. Me and my partner in crime Stefan Wendin have just started an exciting new podcast series on finding, defining, documenting, presenting and achieving Graph Value. You should check it out!
Graphistania 2.0, Episode 15: The Summer Session with Emil
Well this makes me very happy: just before many of us are taking some summer vacations, and ON THE DAY OF MY 2ND VACCINATION SHOT, I am able to publish another Graphistania podcast episode - interviewing my friend and boss (how awesome is it to be able to say that!) Emil Eifrem. We talk about the world, the graph database market, Neo4j the company, and of course, the products. It was a ton of fun, and I even got Emil to agree to publishing the video recording too :) ... Hope you enjoy it as much as I did. Here goes:
Graphistania 2.0 - The one with all the GraphStuff
Yes! Here's another great Neo4j podcast episode for you. I hope you will enjoy it - just as much as I enjoyed recording it with Stefan.
Note that I have put all the interesting links together at the very bottom of the post. They all come from the Twin4j newsletter - to which you should all subscribe, obviously!
RVB: 00:00:44.353 Hello, everyone. My name is Rik, Rik Van Bruggen from Neo4j, and yes, it's that time again. We are recording another GraphistaniaNeo4j podcast. And on the other side of this Zoom call is my dear partner in crime, Stefan, Stefan Wendin. How are you, man?
SW: 00:01:05.215 Always good. Always good meeting up, doing this with you, Rik. It's one of the favourites of the month. And I don't know, what can be better, talking about graphs with your best friend Rik in a sunny southern part of Sweden? Amazing. So good to go.
RVB: 00:01:22.239 Good to go. Fantastic. Great to have you here. And actually, we need to specify one thing, right, before we move on to the real topic of our podcast recording.
Graphistania 2.0: The Lockdown Anniversary session
This weekend marked the 1 year anniversary of the "Covid era" - the time when many of us have been hunkered down at home, or close to home at least, to deal with the raging pandemic. It has been a strange couple of months, and while I personally have been able to deal with it quite comfortably, I must say that my heart has been going out to all the friends and families that have had a far worse time with this. I personally got to experience it first hand in the first couple of months of 2021, loosing a very dear friend to the virus and its awful disease, and will not easily forget this period of our lives.
But we do want to keep the fantastic drive and atmosphere of our Neo4j community up - it would be a terrible shame if we lost that, too, to the virus. So that's why me and Stefan are going to continue making these podcast episodes, at least for the foreseeable future. Not in the least because they are a ton of fun to make :) ...
So here's our latest chat. We have found a true treasure trove of great use cases and such in the Twin4j newsletter, which we will try to highlight:
RVB: 00:00:00.768 Hello, everyone. My name is Rik, Rik Van Bruggen from Neo4j, and yep, it's that time again. Yippee! Yeah. We have another podcast recording day, and for that, I have my dear friend Stefan on the other side of this Zoom call. Hey, Stefan.
SW: 00:00:18.130 Hello, Rik. Nice to be back here with you.
RVB: 00:00:20.830 Hey, there.
SW: 00:00:21.733 Coming back from a week of vacation, so very nice to be back, and what better way to get your graph mind up and running than to hang out with you here in this lovely podcast?
RVB: 00:00:33.018 I hope so too. Thanks for being here, and I hope you had a good holiday. And it's been two months, Stefan, so we really need to get our act together. It's been a very busy--
SW: 00:00:43.185 Holy crap.
RVB: 00:00:44.057 --couple of months, but. We try to do these things once a month, but that didn't work in February, and so we've got a lot to talk about, actually. And maybe I'll just kind of frame it for you. I went through all of the Twin4j this week, the Neo4j newsletters over the past couple of weeks, and I found some really interesting themes. And maybe we can talk about those for a bit. There's three of them. Is that okay?
SW: 00:01:16.179 Yeah, yeah. Let's go. I think that should be super fun.
RVB: 00:01:20.885 Yeah. So the first one I wanted to talk about is, basically, use cases. I mean, we see this all the time in our community, really, right? That there's these unbelievable interesting use cases popping up. There's a couple of them that popped up in the newsletters. The first one is actually dear to my heart. It's something that I started working on back in 2012 when I first joined Neo4j. It's protein interaction networks. Have you taken a look at that one?
SW: 00:01:50.023 Yeah. That was an amazing one. As always with those kind of things, when there is-- this was written by Tomaz, right? So I started--
RVB: 00:02:01.558 Tomaz, [crosstalk].
SW: 00:02:02.277 --reading the article, but then halfway through the article, I was like, "Oh, but I better just try it out." That's how I learn. So I ended up running this, and it is so neat that this is, in some sort of way, so accessible. I think for me, that is super cool in that. So I find it extremely interesting and also because of the simplicity of it and how complex it is, even if it's just such a simple thing as a protein that interacts with another protein, basically, at the foundation, and it's still amazing. I think it's kind of mind boggling in that sense, so.
RVB: 00:02:44.678 A little story from my side: when I first started working with Neo4j, we did some work with the University of Ghent here in Belgium, and they were working on a topic called metaproteomics, which is exactly this, interactions of proteins. And they struck a nerve with me because one of their most important research customers was, of course - drumroll - a brewery.
SW: 00:03:13.135 Of course. I was wondering, "Where is this going to go?"
RVB: 00:03:17.022 Yes.
SW: 00:03:17.797 There it was. Brewery time again.
RVB: 00:03:18.825 There it is. Yeah.
SW: 00:03:20.664 There it is.
RVB: 00:03:21.182 It was a beer brewery, and they were basically saying yeasts that are being added to brewing systems, they create these protein interactions, and if you better manage those protein interactions, you can actually influence the brewing and the taste of the brew by doing so. So that was an interesting one. I had a good time exploring that. There was another one, Stefan, around asset management. This is a very well-known one as well, right? Things like configuration management databases, building information management. It's all about managing assets, isn't it? It's a very networked problem.
SW: 00:04:06.005 Yeah, yeah. And also, this is one of the use cases that seems to pop up more and more often in customer or prospect interactions, I think, so I think it's going to be very helpful for people. So go check it out if you are interested in that. I think that would be very neat to do that.
RVB: 00:04:29.195 But I know you want to skip to the third one that we had [crosstalk].
SW: 00:04:32.095 Yeah, the big one. This is what I'm kind of waiting for, like, "How can we get to this point faster?" Ha ha!
RVB: 00:04:37.534 Yeah. "How can we get to that third point faster?" which is, of course, the use case of getting to Mars and NASA. It was all over the news in the past couple of weeks, obviously, but yeah, that story of how David Meza from NASA-- he's the - how do you call it? - chief knowledge management architect or something like that with NASA, and he worked on that Lessons Learned database in Neo4j. Super cool, right? It's so good.
SW: 00:05:12.489 Yeah. It's super good. I think the use case is good. The interview is also great. David is also very relaxed, I think, also. Ashley - or what is the name of the girl interviewing? - is also doing a great job. There's very good chemistry in there, really enjoyed it. And again, of course, anyone that was dreaming about going to space as a kid, imagine working with such a thing. I mean, it can't get better. This is the moment when you go to work, and you go, "Holy crap. I'm so proud now." But I think it's an interesting thing on how much this actually speed up time for them, right? How much is saved not only time, in that sense, but also taxpayers' money, right?
RVB: 00:05:59.053 Of course.
SW: 00:05:59.211 I think that's what I keep coming back to in talking about use cases. So you can do a lot of things with a lot of technologies, right? So very often, people ask me, "How can I use Neo?" Right? But then I say, "You can do it for this, but you can, of course, do this with your old technology, in theory. However, if that theory takes you two years, maybe you can't really do it in practice." So I keep coming back to think about that, and I think this is such a good showcaser on that. It's a great YouTube clip here, so for those that have a hard time reading or just want to listen while-- I was saying commuting to work. Apparently, commuting to your working room should be better now, in these times. But I really enjoyed it. Happy to see it, so yeah, hope you like it as well.
RVB: 00:06:49.604 Cool. Yeah. It was super nice. And there's another, I mean, theme to the newsletters in the past couple of months. I've seen so many-- it's kind of like a use case, but it's also a technology foundation of people that are using graphs in combination with natural language processing, right? I saw a number of posts from Jesús, our colleague, who was talking about RDF-related work, WordNet, those types of things, but there's also people that are doing really interesting work on extracting new knowledge from existing documents, right? Were you able to make any sense of that?
SW: 00:07:39.354 Yeah. And I think it's like this is also one of those kind of super untapped-- and I think it's also a perfect bridge from NASA, right? Because literally, that was what they were doing. They had the answers; they just couldn't see it, right? So it's a classical, "You can't see the forest because of all the trees," right? So I think that is really interesting. And I think also, there is a great post about-- I think it was called From Text to Knowledge: The Information Extraction Pipeline or something, basically where Tomaz then explained why he see a combination of NLP and graphs as one path to explainable AI, right? And I think this is also one of those topics that are super important from a lot of things to kind of understand but also compliance and a lot of things, right? So I think this is also one of those kind of areas, use cases, or whatever you want to call it that literally are exploding on all different kind of verticals, you may almost use as a word there. But yeah, I think that, again, our--
RVB: 00:08:44.103 Yeah. Well, it's been very popular in domains where there's a lot of documentation, right? So academics, pharmaceuticals, patterns, legal texts, all those things have been really a great showcase for this type of work, I think.
SW: 00:09:04.354 Yeah. No, but as you're saying, I can see anything from academia, patterns-- I mean, I don't know how many of these kind of works that we have done with prospects and really kind of tapping into this kind of super kind of deep knowledge, but you can't see the new perspective because it is just a lot of deep silos, right? So in that sense, it's super graphy, and I think when people start to see it, this is also where they get so excited so were almost screaming, "Take my money," and I was like, "Calm down. Behave good. What is it that you're thinking of answering, or what is the thing that would help you," right? It doesn't have to be the money query, but just don't throw technology at the problem. So be mindful of what you want. I mean, we can see it a lot. I think one of the interesting parts is also looking upon the entire web, scraping information and making sense of it and treating that as a kind of a knowledge grab itself. It's also one of a neat couple of projects that I'm working on personally. Yeah. So there's a lot of funny things to do with the NLP and knowledge graphing combination, I think.
RVB: 00:10:19.330 Yep, totally. Well, what strikes me there-- and this is a perfect segue to our third theme. What strikes me is that it's becoming so much easier to do this, right? So NLP a couple of years ago, that was just so exotic and difficult to use. You basically had to have some kind of a computer science degree or a PhD to be able to use it, but these days, the tools that we have to implement some of these techniques are super accessible. I mean, even a lost sales guy like me can use it. Do you know what I mean? It's pretty usable, even in its basic form. So I wanted to talk about some of the really interesting tools that we see emerging in our community. The one that I was so happy about, to finally see it fully released, is the Arrows app. I think you've used it for a long time already when it was still in an alpha or beta stage, and now it's--
SW: 00:11:26.893 Exactly.
RVB: 00:11:27.278 --actually been released. Alistair Jones' pet project is now finally out there in the wild. Great, though, right? I mean, really great.
SW: 00:11:37.420 Yeah. No, but I think it's so useful in so many ways, of course, for graph modelling, where it was intended, right? And I have a couple of memories working with a lot of C-level people trying to help them understand the power of connected data and so on. So they're not going to write any code, but what we tend to do is do some modelling practices and basic cipher, and for that, I use Arrows. And one of the constant feedback that I get because of the simplicity of the tool and how it naturally kind of lends your thinking to this kind of graph thinking idea is that, every single one of these sessions, these CEOs, COOs are coming back to me like, "Oh, this is a really good way of thinking of the business, the different domain, and how it's connected. It has given me tons of new ideas." So in that sense, that kind of doubled down as a ideation kind of tool almost, if it makes sense, but I think that's such a cool kind of thing, right? If you're going to build an app or if you have a business logic or anything, that really helps you to kind of map it out in that sense. So it's also kind of neat to see that and to see those people, also, stepping into the graph arena. But yeah.
RVB: 00:12:53.804 Yep. That frame also. Yeah. So Arrows is one of those really amazing tools, but there's other things that are coming up, right? We've all known about the GRANDstack, the development framework that's been around for quite some time. A new release for that and new features, capabilities there, and some examples, also, for people to use and to abuse, I would say.
SW: 00:13:18.057 Use and abuse. That's a perfect way to do it.
RVB: 00:13:19.407 Use and abuse, yeah.
SW: 00:13:21.935 Just dive in there and try.
RVB: 00:13:22.283 And then another one that I wanted to mention was I've really enjoyed using this tool that Niels created called NeoDash. It's a graph app that plugs into the Neo4j browser and allows you to put together dashboards on top of Neo4j. Really no-code development, that type of thing, super easy to use. I was very impressed by that, how accessible it's made everything.
SW: 00:13:52.996 Yeah. And I think that's such a great part because I think just the ability to do something without that no code. Of course, that is in the topic with the cloud itself, one of those kind of things that you can really see how accessible these are. But seeing people with no previous knowledge just trying and fiddling around there, they kind of stumble upon the solution almost. That simple. I think the NeoDash is such a great kind of application for just exploring or visualising the data that you have in a graph that you normally would not use. So we tend to try it out with a lot of the nontechnical people when we work, and it works like a charm every single time. There is literally almost no studying kind of to get started, so I again encourage you, as with all articles, use and abuse, right? Dive in, try around because actually, you're going to get kind of far by just doing that. And that is, I think, a common theme for all of these. You can really see how this whole paradigm of connected data is changing, which is, of course, super cool.
RVB: 00:15:17.502 Yeah, absolutely. Well, I mean, so many other things to talk about. What we'll do is when we get to the blog post created together with this recording, we'll also put all the links to the amazing Twin4j newsletter items and the blog posts and everything all together, and then people can have a look, have a play, use and abuse, and that should set them on their path for even more graph adoption, right? So that's the [crosstalk] idea.
SW: 00:15:50.313 Even more graph adoption. Yeah. And I'm also going to squeeze in a last one because we also had the GDS 1.5 release, right? And there's a great piece on it from Amy and Alicia, two of my most inspiring colleagues. They have taught me a lot of things and are super nice as well. So it's about the new supervised machine learning workflows in Neo4j, so imagine that being even accessible to just try. I can't even think of this. If I would have guessed this five years ago, I'd be like, "Nah, that's not going to happen."
RVB: 00:16:29.543 It was impossible. Yeah, exactly.
SW: 00:16:31.365 "That's impossible. You can't do that on your computer at home in your sofa." But I think that's so cool. So that's a great article by Amy and Alicia; go check it out as well. I'm going to push that in there, but we're going to, of course, post the links, as I said.
RVB: 00:16:48.591 We will, for sure. Well, Stefan, thank you so much for taking the time running through this with me and making a little bit more sense out of it. It was great talking to you. You know that we want to keep these things shortish, at least, so we're going to wrap it up for now, and we're going to try to have this one published soon and then do another one in April, right? We should [crosstalk].
SW: 00:17:14.412 Yes, of course, 1st of April. I will record it from my new podcast studio in the barn in [inaudible] in southern Sweden.
RVB: 00:17:22.097 Ooh.
SW: 00:17:23.410 Ooh, yes. And then--
RVB: 00:17:25.195 I look forward to that one.
SW: 00:17:26.657 --as soon as we get to travel, this is a standing invitation for you to come join me and also for any of our listeners. Bear in mind--
RVB: 00:17:37.641 Absolutely [crosstalk].
SW: 00:17:37.964 --COVID restrictions has to be better before that, so I am not encouraging any anti-vaccine behaviour here, but as soon as we are allowed to travel, come join us. It's going to be a great talk about graphs.
RVB: 00:17:51.294 Fantastic. Thank you, Stefan. It was great talking to you, and I'll talk to you soon.
SW: 00:17:55.905 Likewise. Bye.
RVB: 00:17:57.591 Bye.
Hope you enjoyed that as much as we did. If you have any comments or questions, just reach out!
A VERY HAPPY NEW YEAR, everyone! I hope 2021 will beat all of your professional and personal expectations, and OMG aren't we all hoping that we can see eachother in person a bit more this year. Let's make that happen, when it's safe to do so. For now, we will connect with each other remotely, among other things through this page and this... podcast.
Here's a great episode for you. As always, we actually based our conversation on the awesome TWIN4J developer newsletter, which has some fantastic stories in there almost every week - definitely recommend that you subscribe to that one. Our summary of some of the posts is in this document, and here's the recording of our conversation:
RVB: 00:00:20.848 Hello, everyone. My name is Rik, Rik Van Bruggen from Neo4j. And happy new year. Happy new year to everyone, and welcome to another episode our Graphistania podcast. So happy to be here again after this crazy year it was, 2020. And we are going to continue with the good thing that we started last year, which is I have my dear friend and colleague, Stefan, with me on this recording. Hi, Stefan.
SW: 00:00:56.121 Hello, Rik, and hello every single one of you out there in this completely new year, which is going to be, of course, completely different and not anything like the year before. Let's see how that turns out. We all know what's going to happen or what is already happening. But it can just be as good as we make it. So this is what I like doing, this thing with you, because it's really fun and inspiring, and I hope people feel the same.
RVB: 00:01:23.810 Yeah. Same here. Yeah. Thanks for being there. And, as usual, we have a lot to talk about, and we'll probably need to keep an eye on the clock here a little bit. But yeah, there's been so many great things, again, in the graph community that have been popping up. So many great examples that keep coming out in the This Week in Neo4j newsletter, but also everywhere on the community website. It's kind of amazing. I've got a couple of ideas to talk about. Why don't we run through those? Is that okay for you?
SW: 00:02:03.521 Yeah. That would be lovely. And, again, what better way to get your kind of lazy Christmas holiday brain to start than to dive straight in? So yeah.
RVB: 00:02:13.998 Exactly. Yeah.
SW: 00:02:15.499 Any one of those you're thinking of that stand out?
RVB: 00:02:18.754 Well, when I was going through the This Week in Neo4j newsletters, which is what I typically do in preparing for these podcasts, to just kind of see what's happening, right, what struck me is that there's a number of super, super interesting discussions and cases that are all about knowledge creation, how graphs can help you with not just knowledge management, so to speak, and structuring knowledge but really kind of creating new knowledge. People talk about machine learning and AI these days all the time. But it's amazing how things like this-- there was an article about the brain, which is one of those knowledge management tools that use graphs. Or some of the articles that Jesús wrote around multilingual taxonomies or the ArXiv connections. I mean, all of these use cases, they're all about, leveraging existing data, structuring it as a graph, and then using that to create new knowledge, which is fascinating in my book. What do you think about that?
SW: 00:03:39.777 Or maybe it's even like-- it comes, for me, from this fascination of, as you said, everybody running towards the latest technology. But what they do tend to forget is that there's a lot of [barriers?] just underneath their feet, right? But they can't see it. So all of that knowledge is there, however, they cannot see it because it's not connected, right? And I think that's the beauty of the graph and the way you can work with it to allow you to see the things that you already had answers to or the things that you didn't even know that you wanted to know, as I always say. And I think that is also coming back to a little bit on the way I think about strategy and behaviour prediction. I very often do this kind of the way of thinking from a anthropologist kind of view, right? Very like you can't isolate technology in one sense, but you need to study the full culture, meaning values, beliefs, artefacts, tools, behaviours, and everything at once, and I think that's when you get the fuller picture. And I think if there's anything that we have learned in the past year, it's that a lot of questions do not have a yes or no answer. It's not black or white. Very often, it's a nuanced answer. And I think that is the great part with graphs. It allow us to kind of reason about things in a more networking kind of way, so it's almost like it's enabled also. Not uncovering only the knowledge within your data, but it's helping you, actually, to create a more sustainable mental model in the way you think, right? So I think that is a lot of the cool things because if you can't see it, I mean, then you can't really think it in that sense, right?
RVB: 00:05:26.369 Very true. Yeah. One of the examples that was featured in the newsletters was all about these links between academic papers, right? I mean, if there's one place where there's a lot of knowledge being created and managed, it's, obviously, in academia, right? And now, people are starting to look at these things, like structuring academic papers and the links, the cross references, the citations that people make between different academic papers and creating big networks around that, right? And it made me think of you, Stefan. I think I've shared it with you in one of our private conversations as well. But there was this wonderful article that, I thought, was out there by a lady called Anne-Laure Le Cunff, I think her name is. She created this article around thinking in maps. How, actually, structuring knowledge, structuring ideas, structuring data as maps - and maps is just a type of graph, I would argue - is, actually, this age-old metaphor dating from the Lascaux caves back to the Egyptians, back to the Greek cultures. All this age-old technique of structuring data in maps, in graphs to make sense of them, to make sense of information, of knowledge. And some fascinating stuff there. And, obviously, me as an orienteering geek, I also like my maps.
SW: 00:07:16.465 Yeah. You heard map, and then you start running, right? [laughter]
RVB: 00:07:19.504 Yes, exactly. I'm like, "Map? Map, map, map? Where's the map?" But it was a fantastic article, I thought. I don't know if you had any thoughts on that.
SW: 00:07:31.537 No, I think it's so interesting. And also, since COVID around, there was a lot of labs, innovation labs - what I do work with there at Neo - that we also connected all of this kind of medical data, right? Because most of the time, this is also open data sources, but they are very siloed. And that's the problem, I think, with academia. They kind of drill this kind of deep hole with specialised knowledge, and they kind of forget that a lot of the value is also when you connect them. So I think it's super interesting, again, as you said, because if you can't see it, you can't do anything with it, right? And then you start to forget about it. So I think it's super cool to see it. Yeah.
RVB: 00:08:18.875 By the way, I wanted to mention that in almost all of the examples that I looked at in the newsletter and the past couple of months, I found that there's a lot of graph data science actually being applied, right?
SW: 00:08:35.361 Oh, yes.
RVB: 00:08:35.431 I mean, you know that it's kind of a new thing to the graph community, to really have an enterprise grade tool for applying data science concepts to graphs. But I think almost every single one of these knowledge creation examples that we just talked about has a data science component to it. It's amazing how that's been boosted in the past couple of months. You know what I mean?
SW: 00:09:05.233 Yeah. And I think, from a transformation kind of standpoint, what we see here, as you say, there is literally in every single one, right, because all of a sudden, this is now, because of the release of GDS library and what we do, there's a possibility for pretty much anyone to just fire away and start going with this. And one of the things which I think is so interesting, there's a couple of really good articles from Kristof there, like one where he kind of compare Neo4j with NetworkX and do, in his own words, a drag race of sorts, which I think is also interesting to see. A lot of these things, you could do in smaller scale before, but you couldn't do it in the same kind of system where you have your transactional thing. And this is a lot of what I see because if you can put all this power in one system, and that system allows you to work faster, that is the game changer. Because if you can, I think the other article, there is a good example of calculating centrality at scale where the example was something about 20 million or something, and it should take approximately five years to calculate. You can do it in theory, but let me know any business that's going to wait five years for the result of that. That's, literally, not happening. But when you can start to get these examples in real time, then you're allowed to try out things. And I think this is just the beginning of seeing this whole wave of new companies behaving instead of just like the team at Google or some of those big giants, right? Now it's democrat times, so it's for everyone, so.
RVB: 00:10:51.795 Yes. Literally, that's the right word, right? It's democratisation. You used to require a super computer to do this stuff, right? I mean, I don't know if you remember, but Cray supercomputers, they used to have-- they used to have a spin-off company called Yarc. And Yarc, all they did was they sold custom Cray computers that did - drum roll - graph processing, right? That's what they did. And now, you run that on your laptop. The democratisation of this stuff is just so impressive. And I thought it was super interesting to see that article about comparing it to NetworkX because I actually like NetworkX. I think it's a really, really cool tool.
SW: 00:11:44.419 Yeah, it's amazing.
RVB: 00:11:46.967 But if you just look at Kristof's test, you can kind of see, to do something really simple, it takes minutes in NetworkX, and it takes seconds on Neo4j. And then you're like, "Hmm. That's not a trivial thing." That has an impact on the rate of innovation, the rate of how easy it is for people to adopt it, yes or no. That's not a trivial thing. To be able to do things at that speed, it's just kind of meaningful. And I'm quite happy about that. So it's very impressive.
SW: 00:12:26.767 Yeah. But I 100% agree to that. And I think this idea, you can look upon this from the time perspective, this is how much I would save, and then like 1 second compared to 10 minutes, it's not that much. I can go and take a coffee. But I think from an innovation and in a cognitive kind of human capacity, what happens when you are allowed to just try and explore is that you're going to try 100 new things during the rest of those seconds in that 10 minutes time, right, which will allow you to more of, again, the word that we said before, things that you didn't know that you wanted to know that you already, in one sense, had the data, but you couldn't see, right? So I think, again, that's so amazing to see this happening. I've just downloaded and try it out, working with embeddings and stuff during the holidays, and it's mind-blowing. I really encourage every single one of you out there to just do it and go ahead.
RVB: 00:13:27.117 Yeah. And there were some other-- I mean, I think there's some other examples, not just in processing speed but also in how quickly can you get something done. Can you get to an end result? I mean, if I look at the work that Adam did with this new graph app called Charts, I'm like, "Wow. This is so cool." Because I mean, you used to have to develop this entire front-end app to kind of expose this to your colleagues, right, to show it to someone. And now, it's just like click, click, click, click, click, and [inaudible], you're up and rolling, and you can show it to people, not just the speed of processing, but also the speed of development and things like that. GRANDstack, the BI connector, some really cool articles that we saw in the past couple of months that showed that. Really, really quite impressive, I must say.
SW: 00:14:20.687 Yeah. I really second that. And I think this is where we see, again, on a level of transformation within companies, right? Because there's one part to validate your use case from a data and technology standpoint, and then, of course, you need to validate the business part. But one thing, and I worked with Adam in a lot of these labs that we do, right, and this was an idea that we have been talking about for ages, and I'm so happy to see this coming alive because the one times that we tried putting people that literally coming into the room saying, "I hate data because it never works," give them the graph, the power of the graph in a simple interface like this, and all of a sudden, these people stand up and screaming, "I love data. I love graphs." So this is like the graph epiphany moment times like - I don't know - 100 or something. So I'm super happy to see it. And I think, again, it's just amazing to see how much goes so fast, so super cool.
RVB: 00:15:20.954 All right. Well, I think we're going to wrap up it. Just maybe one more question. What was your favourite title of the articles that you read? I know I have one. I have one in mind. [laughter]
SW: 00:15:40.368 Yeah. It's hard to beat that one.
RVB: 00:15:42.801 It's really hard to beat that one. It's a super, super-- Pulumi Platypus And The Very GRAND Stack, yeah. A really cool article. [laughter]
SW: 00:15:50.523 It's an amazing one. The one I was thinking-- actually, I don't know why. Maybe this is, again, me being nerdy again. But when you said any good title, the only one I was thinking was this network analysis of the Marvel Universe.
RVB: 00:16:05.990 Oh, yeah. Of course. Yeah.
SW: 00:16:06.410 But I guess that has nothing to do with titles. It has [crosstalk] me and my childish behaviour that will never leave my body. [laughter] Yeah.
RVB: 00:16:15.794 We love you for it. We love you for it. So hey, Stefan, thank you taking the time to talk us through these different posts. We're, obviously, going to include them in the transcription of the podcast. It's been great talking to you again. And I'm looking forward to a great new series, right, where we're going to keep this up and keep on making these little podcast recordings together. It's been so much fun.
SW: 00:16:41.855 Yes. Super great there. Happy to speak to you again, and waiting for the next one already.
RVB: 00:16:48.182 Me too. Thank you, Stefan. Have a great day.
Yey! I got to do it again. For the 4th time in the history of this weird thing called the Graphistania podcast, I have had the change to spend some quality time talking to Emil Eifrem, our fearless leader and CEO of Neo4j. As last time, we actually recorded the video, so you will find the zoom call, and the MP3 version of it, below in the blogpost - along with the habitual transcription.
Graphistania 2.0 - Episode 10 - This Month in Neo4j
Hi everyone
Hope you are all well, keeping safe, and finding some time to relax and enjoy life in this wonderful rollercoaster that is 2020. Think of it this way - we will never forget this ride, EVAH!
As you can imagine, things have been evolving at warp speed in the wonderful world of graphs as well. So me and my partner in crime Stefan had another chat about all the things we have seen pop up, mostly through the awesome This Week in Neo4j (Twin4J) newsletter. Here's the chat we recorded:
RVB:00:00:01.448 Hello, everyone. My name is Rik, Rik Van Bruggen from Neo4j, and here I am again recording another episode of our Graphistania Neo4j podcast. Wonderful time of the day to start with this type of conversation because I have my dear friend, Stefan, on the other side of this call. Hi, Stefan. How are you?
Graphistania 2.0 - Episode 9 - The one about the (Graph Databases for) Dummies (book)
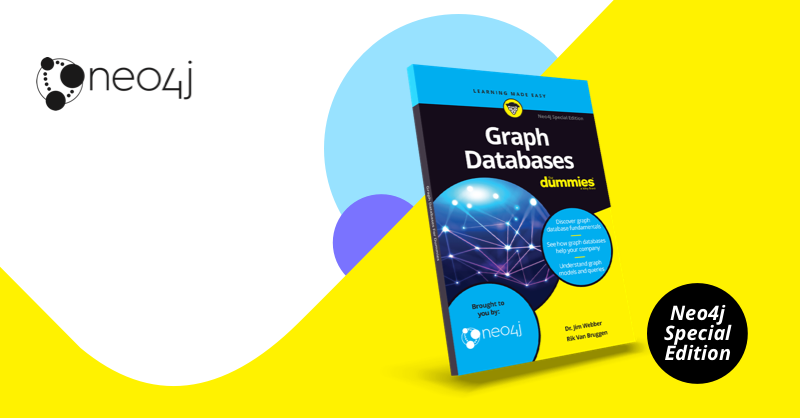
Here's a nice new episode of the Graphistania podcast for you: for the first time in 5 years, I was able to get the fantastically awesome Chief Scientist of Neo4j, Dr. Jim Webber, back to the podcast. Jim is a great colleague and friend, and one of the best tech public speakers in the business - especially when you want to talk Graphs and distributed systems. Over the past few months, I had the pleasure of working together with Jim on a more regular basis - as we actually wrote a book together: the Graph Databases for Dummies book. It was announced on the Neo4j blog, and seems to have been doing really well in the past few weeks. Some of you may remember that Jim co-wrote The O'Reilly book on Graph Databases, and I wrote Learning Neo4j by Packt (2nd edition together with Jérôme Baton) - and we have had a bit of friendly banter going back and forth about the quality of both artifacts :) ... it has been a ton of fun.
So here's the chat that we recorded about the new book - hope you enjoy it as much as we did.
RVB - 00:00:00.151 Hello, everyone. My name is Rik, Rik Van Bruggen, from Neo4j, and here I am again recording another episode of our Graphistania podcast. And this is a special one. This is a special episode, one that we've been talking about for some time, because I have a very special guest on this show, and that is my dear friend and colleague Jim Webber. Hey, Jim.
Graphistania 2.0 - Episode 8 - The one after the Covid-summer
No sure if we should be happy or sad - but hey - the Covid-19 summer of 2020 is almost behind us. Like most people, I found it quite a strange and unusual summer, with very few foreign adventures (although I did manage to squeeze in a cycling/camping trip to the French Alps in July), lots of cycling, some great family time... and of course lots of time with graphs :) ...
So that means that we are also kicking the Graphistania podcast back into gear - here's the next episode for you:
Graphistania 2.0 - Episode 7 - The one after the Covid-19 lockdown
Yes! We were able to record and publish another episode of our Graphistania podcast. It's been an amazing and turbulent couple of months - but before the summer holiday season really takes off we wanted to get this to you.
Wishing you a fantastic and relaxing time - and in the mean time enjoy this episode!
Graphistania 2.0 - Episode 6 - The One with the CovidGraph
So, when I started working with Graphs in 2012, one of the first community use cases that I encountered was all about biotech. I met a few people from the University of Ghent, who were working on some amazing protein interaction networks - and it was fascinating. Over the years, we have done quite a few activities on this, and we have kind of built a nice life sciences and healthcare community around Neo4j. Some amazing work is being done there.
One of the most amazing cases out there, has been the use case of the German Center for Diabetes Research, who have been scouring the scientific universe for ways of finding cures against diabetes. Look at this brief video or read this article to know more about it:
Why am I telling you this? Well, with the global Covid-19 pandemic sweeping around the globe, and many of us being affected in small or big ways, our Neo4j Graph Community has been doing the most interesting things to try and apply the "power of the graph" to this complex and intricate problem. Take a look at covidgraph.org for their work. When I learned about it, I immediately thought about talking to some of the "chief instigators" and inviting them for a podcast interview - which we made happen at record speed :) ...
So here it is: a chat about Covid-19, and about how graphs will help us make sense of the data. Let's hope it proves to be useful. Read more »
Graphistania 2.0 - Episode 5 - This Month in Neo4j
Friends.
These are interesting times. These are difficult times, but we can deal with it together, as a community, as a graph. So that's why we were super happy that, just as Belgium was going into lockdown last week, we were able to record another Graphistania podcast episode for you, talking about the world in general, but also covering some of the amazing graph use cases that drifted over our screens in the past month, in the This Week in Neo4j (TWIN4J) newsletter.
There were actually many things to talk about, in terms of fascinating graph use cases, and I will highlight only the most striking ones here.
Our friends at Kineviz did some really interesting and timely work on COVID-19 temporal and spatial data visualization. This stuff is really important to understand, as pandemic spreads clearly follow graph patterns. Read Connected if you are not convinced.
Graphistania 2.0 - Episode 4 - This Month in Neo4j
Yey! My friend StefanW and I got round to recording another Graphistania episode, episode 4 already - time flies when you are having fun! This month, again, we have so much great content popping up in the This Week in Neo4j (Twin4j) newsletter, that we could probably fill a few hours talking about it. So in the podcast, we will only talk about a handful - covering things like
Various personal graphs projects, like Mark's Australian Open graph and the QuickGraph #3 on Itsu Allergens. I love how Mark summarized it: most of analysis could be done in relational, but "Things got more interesting in the last section where we did set analysis. I found having the data in a graph structure made was helpful for answering these questions, especially when we were looking for the non existence of a relationship."
Graphistania 2.0 - Episode 3 - This Month in Neo4j
Happy new year everyone - although it actually seem like the holidays are already very far behind us! But great times were had, at least in my family, and so I feel super energised to make 2020 another great start to a decade of graphs :) ... Here's to that!
It also means that we are continuing to see all these awesome community stories pop up left right and center in the Neo4j "This week in Neo4j" developer newsletter. And so on our Graphistania podcast, we are going to continue talking about these on a monthly basis. So that's what we're doing - and I have again invited my friend and colleague Stefan Wendin to join me.
From the newsletter, we always select a few stories that we think will be more interesting and/or meaningful to discuss. This month, we found a number of them, and the interesting thing was that the graph-stories seemed to play at very different scales... The Personal, Corporate, and Society levels. Here are some of the ones we liked: